


Site-wide outages (e.g., network or power outages) would cause huge costs in terms of lost revenue and damage to Meta’s reputation. For example, the six-hour massive outage in October 2021 caused significant ad revenue loss, amounting to millions of dollars. For the Meta scale, which spans across dozens of geo-distributed data centers, seemingly rare natural disasters such as hurricanes blowing down power lines occur regularly. Furthermore, man-made incidents such as network fibercuts, software bugs, and misconfiguration can also affect entire data centers. In this blog post, we will discuss how Data Warehouse handles disasters, with a focus on how we recover batch workloads at scale.
Disaster recovery (DR) at Meta
In October 2012, Hurricane Sandy came within 30 miles of the Meta Ashburn data center (ASH) and within a few hundred miles of the Meta Forest City data center (FRC). The destruction of either data center would have been devastating to Meta business, because ASH was a fiber-optic-cables hub that connected Meta to the rest of the world, and FRC contained all of the Meta database (DB) primaries. At that time, Meta was distributed across only three major data centers, and we were not prepared for the loss of an entire region.
With plans at that time to grow Meta infrastructure, the likelihood of regional disasters happening was growing. Hurricane Sandy was a wake-up call, and we asked ourselves if we could run META products without one of our data centers. The disaster-recovery program was born as a result.
After Hurricane Sandy, Meta started to look at the single region failure model to understand how we can prepare infra to handle such incidents. A typical Meta region consists of multiple data centers with a capacity equivalent to 150 MW of power consumption. Any Meta region could go down due to various factors such as natural disasters or man-made incidents. The strategy for tolerating single-region failure is to drain the region: We would redirect traffic away from the affected region, toward other healthy regions. This approach, however, raises a few challenges:
- Dependency: Meta runs thousands of micro-services and dependencies among all these services, which leads to complex operations, so we need to drain the system gracefully based on each service’s dependencies.
- Capacity: If other regions are already consuming all the available capacity, moving more demand to those regions might cause overload. As a result, Meta decided to add extra capacity, aka DR (disaster recovery) buffer, which provides the healthy regions with enough resources to absorb the traffic from the faulty region without any overload risks.
- Replication: We introduced global replication to ensure that service and data is available to serve workloads even when one of the regions is down.
- Failover: For stateless services, we leverage Tupperware scheduler (Meta’s container orchestration system to deploy and manage services) to handle failover gracefully For stateful services, upon failure, states would be recovered and reconstructed in a timely bounded manner.
(Refer to 2023 Reliability@Scale presentation for the evolution of disaster recovery at Meta.)
Data warehouse at Meta
Source data
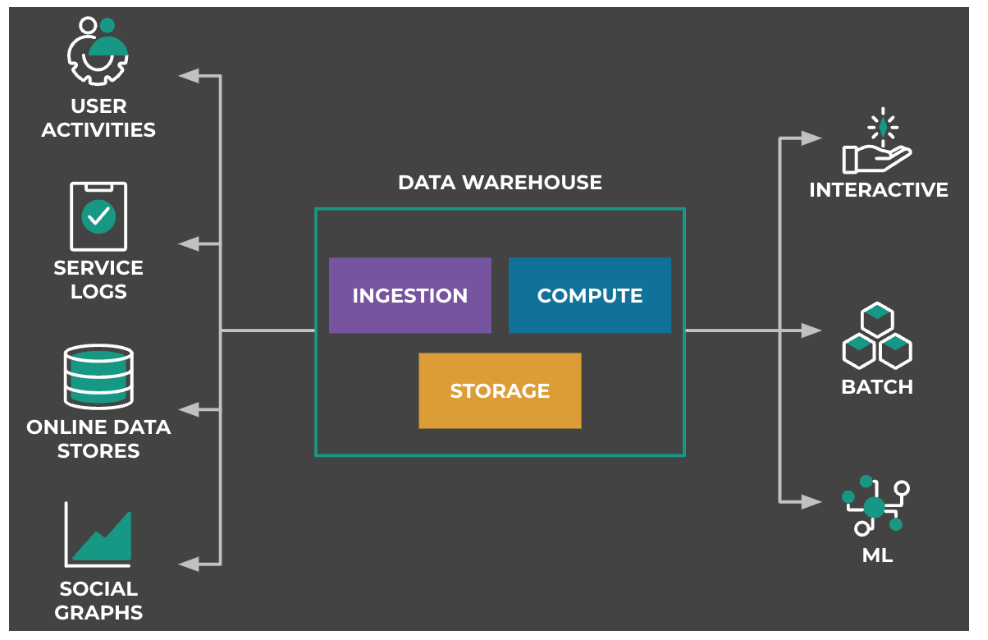
Warehouse data come from various sources: activities from Meta applications (such as Facebook website, Instagram, and WhatsApp); service logs from web servers or internal services; online data stores and social graphs. All the above data (structured and unstructured) is stored in Warehouse via ingestion services, which then serve various purposes such as data analytics, monitoring, and ML training.
Warehouse architecture
Data Warehouse consists of several components that work together to provide a scalable and reliable platform for data storage and processing. Some key Data warehouse components are:
- data ingestion: Data ingestion is the process of collecting data from various sources such as databases, logs, and APIs and loading it into the Data Warehouse. Data ingestion is done using Scribe (Meta’s distributed messaging system) and FBETL (Meta’s data ingestion system).
- data storage: Once the data has been ingested, it is stored in the Data Warehouse using Warm Storage.
- data processing: Data processing involves transforming and aggregating the data to create new datasets that are more suitable for analysis. This is typically done using tools such as Spark, Presto, and Digraph.
Other key components include data integrity and data governance.
For Meta scale, warehouse workloads cannot fit into one region. Instead, workloads are partitioned by namespace, which is a logical container for data storage and compute, and can be used to control access to the data and to enforce security policies. A namespace usually contains thousands of tables, and each table can be further partitioned into more manageable pieces called partitions. Namespaces are placed on a specific region or across multiple regions based on namespace resource requirement and available hardware in each region, with the goal of minimizing costs over the planning horizon.
Warehouse disaster recovery
Our Meta infrastructure teams have done an enormous amount of work to develop the disaster recovery (DR) strategies we have today, and that is particularly true for Warehouse, which historically was viewed as mostly an offline system.
As a company, we do quarterly, company-wide disaster readiness storms that take a data center region offline. The first storm to significantly impact the warehouse was Thunderstorm in July 2015. We only kept data for each warehouse namespace in a single region, so our plan was just to take a four-hour downtime for those namespaces. Unfortunately we had an undiscovered cross-region dependency, so the whole warehouse went offline, and even worse, we didn’t have enough capacity to recover, so users and Data Warehouse engineers were significantly impacted for four weeks until we fully recovered.
To further emphasize the importance of disaster recovery and why our users care about it: Consider that to do their work, many of our customers need our tools to remain available, and until 2021 we would have taken them completely offline whenever disaster happened. Not only do those tools now remain available, but the investments we’ve made have also significantly reduced the work required by all of our teams for handling disasters.
Fundamentals
Prerequisite
For warehouse DR, there are two prerequisites: capacity and global replication.
Starting in 2018, Warehouse began to deploy extra DR buffer in each region. As mentioned above, when disaster happens, this additional capacity enables the healthy regions to absorb the traffic from the faulty region without any overload risks.
For global replication, Warehouse leverages the Replication service to achieve a replication factor of at least two. For each partition landed in the primary region, the Replication service makes an extra copy in a different region. This is an asynchronous procedure: When disaster happens, recent landed data may not yet have backup copies available.
As of 2023, Replication service is operating on a few Meta regions, and Warehouse holds tens of exabytes of data. For daily backup data, Replication triggers millions of replication jobs to handle hundreds of Petabyte data copies.

DR orchestration workflow
When disaster happens, Warehouse will failover workloads from the affected region to healthy regions and recover missing data accordingly. All these operations are orchestrated via Warehouse DR workflow.
The prerequisite for kicking off the workflow is that DR capacity is ready and Warehouse replication is healthy. The first phase in the workflow is failover, in which we update corresponding configurations to mark the affected region to disaster status and redirect traffic to other healthy warehouse regions. In practice, this phase usually takes five or fewer minutes. In reality, the response window could be whatever time lapses between when disaster occurs and when we recognize it.
The second phase is recovery, in which we recover backup data (that had not been replicated due to replication delay) by replaying the original pipelines with idempotency assumption. Ingested data can be recovered via Scribe and FBETL services, and batch-workloads-generated data can be recovered via replaying Dataswarm pipelines.
As is shown above in Figure 2, the performance of batch-workloads replay determines how fast we can recover the missing data (or states). And in the next section, we will focus on recent improvements to this part.
Warehouse DR practices at scale
In practice, we conduct different types of DR exercises to validate warehouse DR readiness. First, we conduct table-top exercises and DR drills with frequent cadence to highlight DR readiness risks and work with partner teams on mitigation strategies. In addition, we practice Zero-Notice DR Storms. These are Meta Disaster Readiness Exercises where we isolate a whole production region to validate end-to-end readiness for the single-region failure (e.g.,in the FTW storm in Spring 2022, we practiced failing over more than 30% storage of the entire warehouse). Running DR storms helps Warehouse understand dependencies outside of the Warehouse and potential user impacts. Furthermore, we proactively run DR orchestration workflows to mitigate emergencies such as capacity crunch (or power loss) in a certain region.
Batch-workload recovery
As mentioned in the previous section, replicating data from primary region to backup regions happens asynchronously. In addition, data copy could be delayed due to various reasons, such as insufficient capacity to handle burst demand, service overloading, throttling, and transient errors. Considering the Warehouse-data scale, when disaster happens there could be a considerable amount of recent data that don’t have backup replicas.
Locating missing data
Replication latency
Missing data is associated with replication latency. To approximate the replication latency, Warehouse uses replication lag, which represents the oldest creation time of the data that have been landed yet not replicated. We’ve been using replication lag as the SLA for Warehouse DR for a long time. The metric is easy to get and understand, and if it’s under certain hours, we have a high level of confidence that if disaster happens, we can failover to the backup region and recover the missing data within bounded time.
The biggest issue with using replication lag as the single metric (for DR replication readiness) is that it does not reflect the true gap between primary and backup regions, as the replication system does not guarantee FIFO semantics.
It’s very hard to achieve FIFO in large-scale distributed systems. In reality, a few replication jobs could be stuck due to various reasons (e.g., throttling and transient errors). In addition, load imbalance caused by factors such as inter-region capacity restrictions further complicates the replay range.
Real-time report
Given that disaster could happen in arbitrary time, it’s necessary to provide a real-time view for the (exact set of) missing data. The solution is to build a real-time replication, factor-checking service that continuously monitors and updates the delta differences between the primary region and its backup region for any given namespace.
Retrieving replay tasks
After locating the missing data, we need to figure out the corresponding pipeline tasks and replay them to recover the missing data in the healthy regions. A pipeline includes three key elements:
- Task/operator: What steps need to be taken to achieve our desired result (e.g., joining two tables to generate the output)?
- Schedule: When/how often should the tasks be executed (e.g., daily)?
- Dependencies: What needs to happen before each task can begin (e.g., start computation only after today’s data lands)?
The legacy approach extracts all tasks with creation time falling within the window <replication_lag, failover_time>. However, this approach is neither efficient nor correct. It causes lots of redundancy, since it would backfill data that are already replicated to the backup region (but still fall under replication lag window). In addition, there are dependencies among tasks, and failing to honor the task dependencies such as the legacy approach would incur failures.
Task dependencies
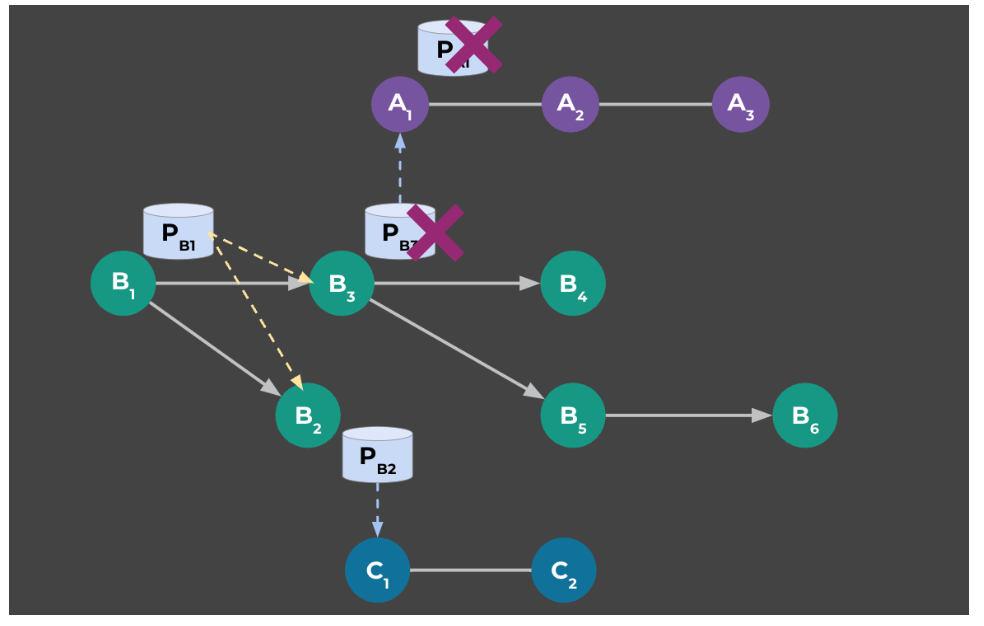
As is shown in Figure 3, assume we have three pipelines: A, B and C. Tasks could have intra-pipeline dependencies (for example, tasks B2 and B3 depend on PB1, the output of task B1). Tasks could also have inter-pipeline dependencies (for example, task A1 depends on PB3 as input, which is the output of task B3). For replay, assuming pB3 and pA1 are missing data, we need to execute task B3 then A1. Otherwise, task A1 would fail and desired output PA1 could not be recovered.
The fundamental challenge here is to construct dependencies to honor execution order, and this is the key to addressing the two biggest challenges in batch-workloads recovery: correctness and efficiency.
The key idea is to leverage data writers to record task information when landing data. For example, after Presto finishes the computation against input data and writes output data to the warehouse, it adds the task information when registering the metadata of the output into the Warehouse metadata registry. Then, to retrieve the corresponding task for the given missing partition, we can extract the task information from the metadata registry.
One more challenge here is that different types of data writers might record different types of task information. For example, Spark only records its container information, and we need to resort to container service to retrieve the task information. To solve this challenge, we’ve built a translation layer to convert various types of raw information to the standard format.
For pipeline tasks, the standard format for a given task is <pipelineTaskName, periodId>, in which periodId represents the scheduled time to run the task. Most pipelines run periodically (e.g., daily or hourly) and task schedule time is needed to identify which task instance to replay.
Reconstructing task dependencies
Building the full-lineage graph to cover all dependencies is a straightforward idea, and we resorted to existing lineage-tracking tooling that was built for dependency analysis. Building full-lineage graphs is expensive, however, and the tooling couldn’t provide freshness and scalability guarantees of the lineage data.
What we need is real-time dependency retrieval. And the key idea to solve the challenge is to leverage the WaitFor task, a sensor task that delays the following task(s) until the specified data is found, and repeatedly check the data readiness. To allow this approach to succeed in practice, we worked with the partner teams to enforce pipelines to specify explicit WaitFor tasks or enable automatic WaitFor tasks.
This key insight allows us to reduce the problem from building a full-lineage graph to only retrieving immediate upstream WaitFor tasks. This simple yet elegant solution has been proven to solve all types of complex intra-pipeline and inter-pipeline dependencies.

Let’s revisit the previous example and see how the old and new approaches work. We’ll assume the output data for task B2, B4, C1 and C2 are missing and task B2’s output is the oldest data that has been landed yet not replicated (to the backup region).
The legacy approach simply locates all tasks with creationTime equal to or greater than task B2’s creationTime and replays them. This includes all tasks across three pipelines (except B1). In addition, a few replay tasks will fail since they are not waiting for dependent data (e.g., tasks A1 and C1).
The new approach: In contrast, the new approach locates the exact set of tasks (B2, B4, C1, C2) and retrieves immediate upstream WaitFor tasks. In this example, we get two WaitFor tasks: one for inter-pipeline dependency (B2->C1) and the other for intra-pipeline dependency (C1->C2). Then, the new approach submits the minimum set of tasks for replay, and execution orders are guaranteed via the WaitFor tasks.
Recovery at scale
To handle the scale of missing data in Meta Warehouse, we have evolved the solution in multiple aspects:
- Freshness: To reduce the risk of unexpected delays in calculating missing data against large datasets, we build validation logics to periodically refresh missing data-reports caches in the Replication-factor checking service.
- Completeness: We conduct extensive analyses to narrow down and categorize the unknown mappings between missing data and tasks, and build corresponding handling logics. We further filter out unnecessary data and tasks (e.g., user-triggered replay tasks) to minimize false positives.
- Scalability: We handle missing data and tasks in batches. To enable this, we evolve the solution to batch manner, and build batching facilities in corresponding dependent services (e.g., batch-task info retrieval, batch-task submission). As a result, we can process large amounts of partitions and tasks in batches with partial-failure support.
The new approach enables us to recover an accurate set of missing data in disasters. We have demonstrated its effectiveness against production workloads in recent DR exercises. Compared to the legacy approach that could only process tens of thousand missing partitions, the new approach can process more than one million missing partitions during recovery.
In addition, the new approach can eliminate approximately 75% of redundant recovery (false positives) and cover more than 10% of missed recovery (false negatives).
Future work
This valuable disaster recovery work does not end here. Let’s look at what lies ahead for warehouse disaster recovery.
As our infrastructure grows, the likelihood of multi-regional outages increases, and we anticipate seeing such failures happening more often. Internal statistics show that the times between two regional failures are diminishing, which means that we anticipate multi-regional DR events to happen more often in the next few years. For example, in February 2021, severe weather in Texas and Nebraska caused power disruptions affecting the PNB and FTW regions.
Adding capacity is not scalable when the number of regional failures goes up, so we need to think about other solutions such as service degradation.
In addition, ML workloads have a growing footprint in Warehouse, and we need to build DR complaint strategies for training freshness, such as reducing ML-training landing delays during a disaster.

