


Meta turned 20 this year. And in this time, the company has grown from one product to multiple user-facing apps, launched new hardware on the multiverse, and has now launched cutting-edge AI models. Our infrastructure has grown fourfold in the last five years, and it will continue to grow, pushed by newer trends in the industry. On a daily basis, Meta serves 3.27 billion users on a daily basis. What makes this possible? Thousands of microservices running on millions of machines across our data centers, all of which handle multi-trillion requests per day.
The end-to-end journey for every user request in our apps traverses thousands of hops across Meta’s distributed architecture. Each hop represents a client library, privacy and security frameworks, microservices, configuration files, data stores, and hardware, as illustrated in Figure 1 below.

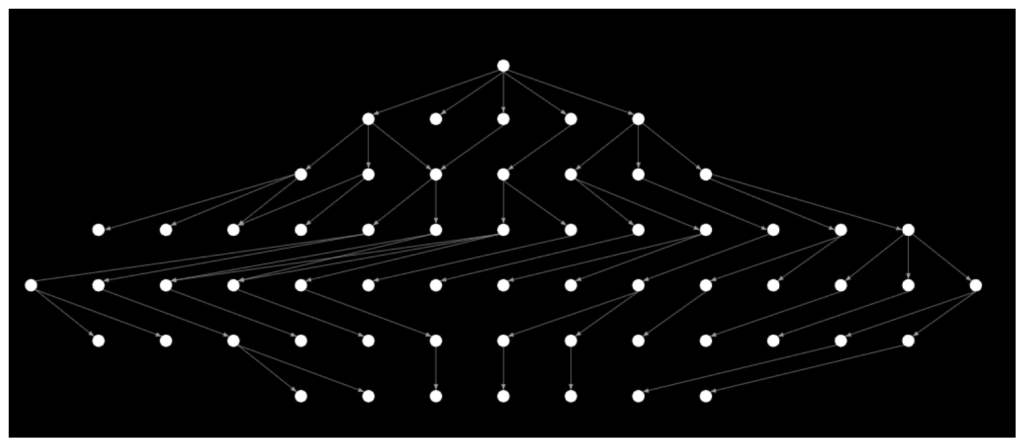
These dependencies are all interconnected, making the depiction of our infra a massive, tightly coupled graph, as seen in Figure 2. This is a snapshot of production data, a zoomed-in view at 5,000 feet, showing how services operate in a single rack of servers. And this shows only the tip of the iceberg, because we haven’t yet completed instrumenting all the connections among these microservices. When on-the-ground reality is this complex, engineers will have a difficult time root-causing issues, containing the blast-radius of outages, and recovering from systemic failures.

The tight coupling of our infra has been a blessing and a curse. A blessing because teams ship features faster when they can easily utilize dependencies on other components. And a curse because dependency issues are among the top four triggers of severe outages at Meta, are consistently ranked as a top barrier to reliability, and are cited as one of the top risks by reliability champions across the company. This makes dependency issues costly in terms of
- User engagement: Rendering our apps unable to use, and slowing down millions of people who depend on our product.
- Developer velocity: Debugging every outage costs many hours and hence slows down the developers.
- Business efficiency: This in turn slows down the rollout of new features and fixes to our end users, affecting overall business efficiency.
As our infra has grown fourfold in size over the past five years, the issues brought by our laissez-faire dependency policy—take any dependency you want!—have now cast a shadow over its benefits. The most problematic issues are the time required to mitigate dependency site events (SEVs), which is twice the amount of time needed for other SEV triggers, and the risks that cyclic dependencies are creating for many of our recovery efforts.
Since we expect continued exponential growth of our infra, we’ve set up a three-pronged program to untangle our dependencies before the issues compound. In this blog post, we will go into detail on each of the different arms of the program, describing the tools and processes we’ve built to tame some of this complexity. We will start by covering how we upleveled our incident response with our reactive dependency safety effort, then go over how we’ve prevented serious production incidents through our proactive dependency safety effort, and, last, conclude with how we’re federating our approach to all of Meta.
The Inadequacy of Reactive Responses
It’s hard to mitigate an outage when its trigger is a service that sits multiple hops away from yours. In an infrastructure like ours that is composed of thousands of services, mitigation becomes an almost impossible task without proper tooling.
That’s the place we were in almost four years back. Fifty percent of issues in some of our most widely used user apps were blamed on upstream dependencies failing, and there was no way for us to find which part of the user journey was broken and why. User engagement was being affected—and users weren’t happy. Continuing to firefight these user issues was also making developers unhappy.
Fast-forward to two years later, and although dependency SEVs were still occurring, in two of our apps we’d built the tools that allowed us to cut down mean time to mitigate by 50 percent. To limit the amount of app downtime our customers experience, we needed to identify the critical services powering a user interaction through distributed tracing, detect when they are unavailable, and diagnose issues faster through visualizations and correlation analysis.
Identifying Critical Dependencies through End-to-End Distributed Tracing
Debugging is one of the biggest challenges in a complex architecture where every single request triggers hundreds of micro-services in its journey. Meta’s infrastructure has had distributed tracing available for our infrastructure services for a number of years. But we lacked a mechanism that connected the backend services tracing data with user flows in the client applications.
End-to-end distributed tracing provides observability into the execution of user requests, starting from the device and continuing all the way to the data stores.
To connect the dots and build traces end to end, we enabled context propagation on user requests from client devices, both web and mobile. Context is any relevant information in the span of a user interaction/session with our apps. Context propagation essentially transports that relevant information across necessary hops on the user call path. As the context gets propagated, we also add exhaustive instrumentation at every critical node in our call graph to log enriched information. This enables us to build the graph of the computation that a request initiates, as depicted in Figure 3.
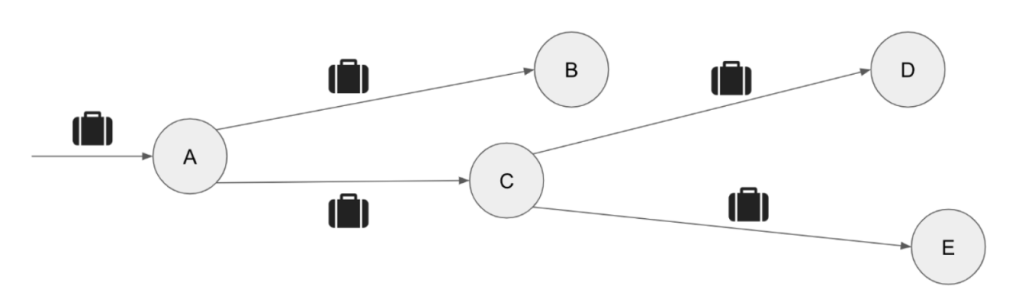
For our use case, we identified the most critical user interactions on Meta apps and added instrumentation on the frontend to track the success and failure rates of user requests. This instrumentation helps detect when user interactions are broken or “down.” We then propagated these interaction IDs into our backend tracing infrastructure as “context,” across all service hops, with our distributed tracing system.
This enabled us to identify the end-to-end dependencies in the context of the most critical user interactions, as shown in Figure 4.
Faster Detection
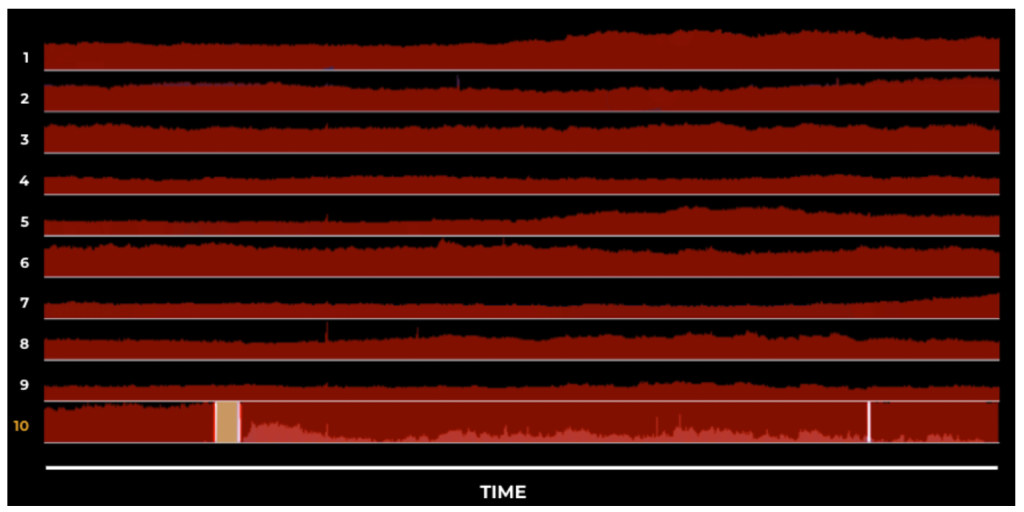
For faster detection, we need real-time metrics. With context propagation and enhanced instrumentation, we enabled real-time monitoring of the success and failure rates of these critical user interactions, as well as our dependencies across the fleet. We configured and iterated on alerts with exhaustive data analytics to define the correct thresholds and pick the correct algorithm to identify anomalies and unexpected patterns. It was critical to be able to slice the metrics in real time by all relevant granularities: region, data-center, machine, service, deployment, product, endpoint, and so on. Now we could monitor all the individual pieces in the user journey—at the lowest level of granularity—and get alerted within minutes when a user interaction broke or a service went down.
Figure 5 illustrates monitoring user interactions and dependencies next to each other in real time where interaction 10 is showing a broken user experience.
Faster Diagnostics
We have established that for diagnostic purposes, every product in our company has a huge dependency graph, and we need real-time metrics. What we wanted next was to be able to trace a user interaction from the top node all the way down to the leaf nodes, and at the same time, figure out which node in this dependency tree is affected at any given time, and why.
To accomplish that, we built a comprehensive diagnostics surface (see Figure 6, below) that provides visibility on live events inside our infra through event discovery and exploration.

This tool enables us to fetch dependency graphs for any product or microservice in the company. And on this graph, we can enable overlays for relevant metrics and events to diagnose the root cause of the outage. The overlays consist of error rates, latency spikes, data drops, regional drain tests, deployments in production, active outages in related systems, and circular dependencies, where two services have hard dependency on each other.
In addition, we set up the generation of automated analyzer reports that periodically run to observe changes in product top-lines and correlate user-interaction metric regressions with our real-time system metrics. The resulting dependency graphs not only enable us to correlate incidents but also help narrow down the bad diffs and deployments in real time from among the code and service deployments in production.
Providing a holistic view to the developer to observe anomalies and diagnosing the root cause of outages has significantly helped cut down on incident time.
How It Looks in Production

Figure 7 illustrates how our end-to-end setup works when user interactions break in production.
- Detected failures are occurring on the frontend: We added instrumentation on the client apps for the most critical interactions and configured monitoring setups with relevant alerts. As a result, if user-facing errors now spike in our frontend instrumentation, we can quickly detect that an issue has occurred.
- Diagnostics surface with a dependency graph built from distributed tracing, and event discovery on services enables root-causing issues to a specific dependency that’s failing.
- From here, product on-calls and service owners work together to mitigate the problems.
This end-to-end tracing from the device all the way to the data stores enabled us to cut down on time-to-mitigating SEVs by 50 percent.
Dealing With Cycles, Proactively
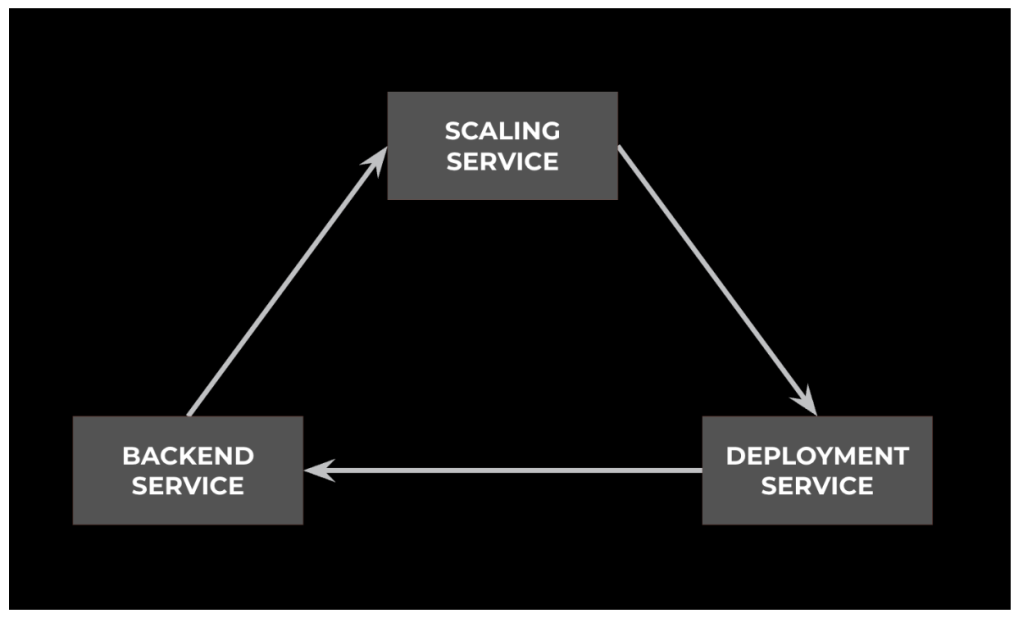
For some dependency outages, it’s impossible for us to have quick mitigations despite having comprehensive end-to-end visibility. This is especially true when we’re dealing with circular dependencies between services. (See Figure 8.) Throughout the years we’ve experienced several close calls where outages could have dragged on for hours, or even days, due to circular dependencies. For example, a year ago:
- Our binary distribution service was experiencing overload.
- This caused binary downloads to fail.
- To mitigate the overload, we needed to scale out the service horizontally.
- But we couldn’t scale out, because to start new instances, we need binary downloads to succeed.
Fortunately, this was one of the circular dependencies we had identified ahead of time, and we had well-tested escape hatches we could leverage to break it. Unfortunately, though, we’re not that prepared across the board. Our infra is riddled with circular dependencies, and removing them all will be a costly pursuit.
Creating a Policy for Which Dependencies Are Allowed
We want to mitigate the risk that circular dependencies bring without forcing teams to reinvent the wheel to completely avoid a dependency. From past experience, we know that reinventing the wheel to avoid a dependency comes with its own set of reliability challenges.
Taking that into account, we’ve settled for the following policy:
- “Nice to have” functionality needs to be cut (ideally), or made best effort.
- “Critical” functionality with circular dependencies needs to provide escape hatches that solve the chicken-and-egg problem.
- Fault-injection testing needs to be established to continuously verify best-effort functionality, escape hatches, and fallback paths.
What makes our policy work effectively is the last step. Without continuous validation, the problematic dependencies will creep back in. That’s why we’ve invested in testing frameworks that allow us to apply our policy across our infra.
BellJar: A Tool to Verify Escape Hatches
BellJar, which was covered in a previous @Scale blog entry, continues to be one of the most important tools we have at our disposal to verify that the risk from circular dependencies has been mitigated. (See Figure 9.)

It provides teams with a disposable, production-like environment where they can test their fallback paths. BellJar takes two inputs:
- An allowlist that describes which infrastructure services will be available in the environment, while everything else will be blocked
- A list of shell commands that will be executed inside of the environment while the allowlist is in place
The list of shell commands in a BellJar test constitutes the runbook a team would follow during recovery to start their service. We call these recovery runbooks. They often include steps that set services in special modes of operations to break circular dependencies.
The entries in the allowlist are considered the critical recovery dependencies for a service. These are the absolute minimum set of services needed for the recovery runbook to succeed.
To untangle our dependency graph, we expect there to be no circular dependencies when we look at the allowlists across the tests written by all services. If there are, we work with the service teams to remove those dependencies or to create a fallback path that will be exercised in one of these tests.
Dealing with BellJar Test Coverage Gaps
Although BellJar is an excellent tool to find out the critical recovery dependencies that occur during service startup, its ability to find critical runtime dependencies is limited, since it relies on the test author’s willingness to exercise several endpoints after their service starts up. And since test authors don’t have a comprehensive view of which of their endpoints are critical for their many users, gaps are often found during production incidents.
To compensate for the lack of visibility on runtime dependencies in BellJar tests, we’re now leveraging production data. By tailing in real-time multiple datasets that capture remote procedure calls (RPCs) across our infrastructure, we can find the problematic runtime dependencies services might take. Whenever we find one, we will flag the issue to the teams and prompt them to cover the relevant code paths in their existing BellJar tests. Once they do, our system deems the risk coming from the circular dependency as mitigated. (See Figure 11.)

Tying It All Together: Federation
Our reactive and proactive programs have touched only a small subset of our entire infrastructure and product line. Going forward, we need to scale both of these so they touch all the user-facing products as well as the thousands of services that exist at Meta.
To do so, we federated our approach by leveraging a well-established internal tool that tracks how mature any given product (end-user facing or infrastructure service) is across key reliability dimensions.
To track maturity, the tool divides maturity into four levels: basic, foundational, intermediate, and optimized. Every level has a description of what it takes to reach it and, ideally, a metric that’s automatically calculated and attached.
In this tool, we added a new dependency-safety dimension, with the following descriptions:
- Basic: Teams have an ad-hoc, high-level understanding of their products’ most obvious dependencies, learned through writing the code and operating the service.
- Foundational: Teams have the instrumentation in place to be aware of their end-to-end critical dependencies and to react to dependency SEVs promptly.
- Intermediate: Teams have set up alerting on new dependencies and take no new unaddressed dependency cycles.
- Optimized: Dependency SEVs are autodetected, and the service has mitigated the risk from all dependency cycles.
As more and more orgs in the company rely on this tool to determine which reliability investments they should make, we hope to take all of our infra from basic to optimized. That way, we would be untangling the graph, reducing the risk that dependencies pose without limiting their benefits.
Although we have the strategic framework to scale, the tools we’ve built to address reactive and proactive dependency issues need to scale too—from enabling end-to-end tracing everywhere in a cost-sensitive way to devising better ways of breaking circular dependencies, and to increasing confidence in the results through repeated production testing. Our journey is just starting.

