


Overview of Monitoring at Meta
Since its inception, Meta (formerly Facebook) has invested heavily in software and hardware infrastructure. Today, our software stack comprises thousands of software systems that power real-time content serving, long-term data storage, analytics workloads, privacy controls, and our rapidly evolving machine-learning capabilities.
This software infrastructure is hosted on our homegrown physical infrastructure: a collection of globally distributed, custom-designed data centers that together house millions of servers communicating over high-speed interconnects. And now, we are pivoting our infrastructure towards supporting AI training and inference at scale; this transformation is introducing new hardware types (optimized for GPU workloads), new data center types, and new software stacks.
At this scale, failure is inevitable. Individual systems fail routinely. Data centers must manage the risks of natural disasters and stressed power grids that are being exacerbated by climate change. At the same time, as our systems grow in size and complexity, human error is a growing risk.
Monitoring tools are valuable on a day-to-day basis. In the midst of an outage, however, they become indispensable. This fact has been the primary motivation for Meta’s monitoring organization to broaden the focus of its reliability programs beyond the day-to-day availability of individual monitoring systems to also include holistic end-to-end measurements and an explicit focus on resilience to failure. In fact, we expect our monitoring systems to be among the most resilient systems at Meta.
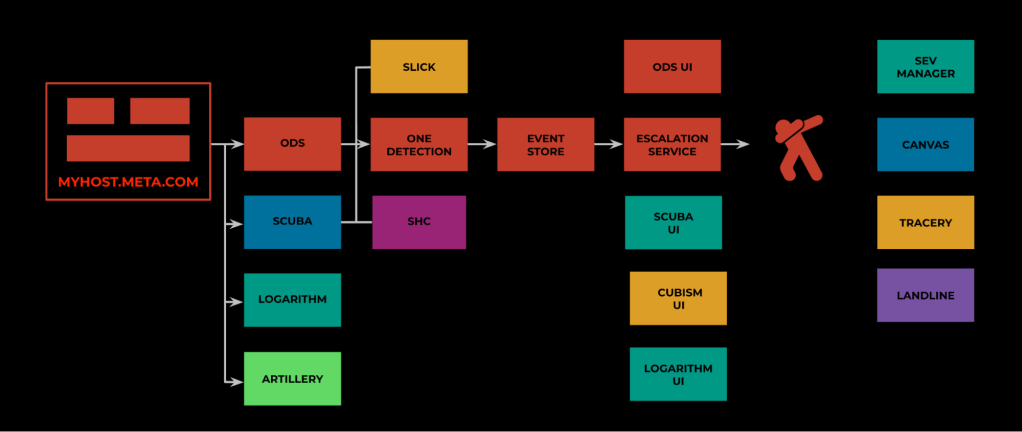
Figure 1: Monitoring data from each server flows into a collection of tools for detection, alerting, root cause analysis and incident management
Meta’s monitoring infrastructure comprises nearly a dozen separate systems. We have three primary data stores: a massive time series store that ingests and indexes more than 150 billion time series each day, spanning everything from data center HVAC metrics to individual application error rates, a near real-time, in-memory database that ingests millions of structured logs per second from applications across our stack, and an analogous system that ingests and indexes gigabytes of unstructured applications logs per minute. These data stores are used by thousands of engineers every week, but they’re also continuously queried by a collection of detection and alerting systems that leverage them to verify the health of our infrastructure at large.
When a problem is detected, a human is notified, and our incident responders leap into action. Incident response requires assembling a team of experts, drawn from different parts of the company, into a data-driven effort to determine the root cause of the problem and identify a way to quickly mitigate its effects. This exercise relies heavily on monitoring data and monitoring systems; without them our incident responders would be flying blind.
When Monitoring Fails: What We Learned from the Facebook 2021 Outage
On October 4th, 2021, a routine network-maintenance operation went awry, causing traffic to be simultaneously drained from all of Meta’s backbone routers. This led to our data centers being disconnected not only from each other but also from the rest of the world. This was followed by a near-instant global outage of Facebook, Instagram, and WhatsApp that lasted more than six hours. During this time, incident responders were unable to access any internal systems, including monitoring systems.
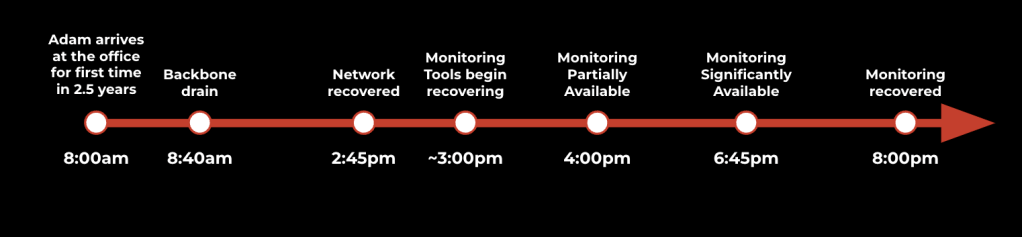
Figure 2: A timeline of the 2021 Facebook outage
After we restored the network backbone, our monitoring systems faced an unprecedented thundering herd of requests from two sources: tens of thousands of engineers trying to understand the state of their systems and recover them, and thousands of disconnected systems suddenly coming back online. During this time window, some monitoring systems were faced with loads four to 10 times larger-than-typical daily peaks. This overload scenario led to a second, less visible but no less concerning phase of the incident—several hours where our monitoring and observability systems were operating in a degraded state—just when we needed them most.
Never waste a crisis. The 2021 outage was a catalyst that prompted us to rethink the way we approach system reliability, and to reorient our organizational culture towards embracing resiliency as a core engineering value.
Building Resilient Systems: Know Thy Enemy
Before we could improve the resilience of our monitoring systems, we needed to deeply understand the factors that threatened that resilience. The 2021 outage provided valuable anecdotal lessons, but we did not wish to over-index on a single incident. So we decided to examine dozens of smaller incidents to identify common failure modes and recurring root causes of failure. And we took a holistic look at our preparedness—How well were our systems insulated from events that could trigger large-scale outages?
The problem areas that emerged were:
- Nonuniform Disaster Readiness: Each of our monitoring systems had set its own standard for disaster readiness. The lack of cohesive readiness criteria meant that it was difficult to understand the readiness of our monitoring systems as a whole.
- Insufficient Overload Protection: Our existing overload protection mechanisms were focused on mitigating overload that originated with one or a few clients (for example, noisy neighbors). But our systems were underprepared for massive overload scenarios like we observed during the 2021 outage.
- Inadequate Monitoring of the Monitoring Stack: While our tools are widely used to monitor other infrastructure at Meta, we lacked broad, end-to-end monitoring of the monitoring stack itself.
We have since embarked on a long-term effort to systematically mitigate each of these risks.
Building Uniform Disaster Readiness
Disaster readiness refers to the ability of a system to be resilient to sudden external failures (such as the loss of power in a datacenter hosting the system). The set of possible events is large and diverse, but our analysis led us to focus, at least initially, on sudden loss of compute/storage capacity (for example, a network cut, or a datacenter power loss). Natural disasters, wars, and electricity shortages in specific regions have helped us to understand that individual data centers are increasingly vulnerable to outages.
Addressing those vulnerabilities requires understanding that Meta’s monitoring systems were not all designed together as part of a grand architectural vision. Instead, they have evolved over time in response to the monitoring needs of a diverse community of users. These systems are also built, owned, and operated by different engineering teams at Meta. While this model offers incredible flexibility for individual systems (and teams) to focus on specific problems, it also makes it more difficult to establish uniform operational standards across these systems and teams.
Yet because our monitoring infrastructure is only as strong as its weakest link, a uniform standard is exactly what disaster preparedness requires. So, we assembled a team of engineers that spanned all of our systems and began cataloging the disaster preparedness of individual systems. As we expected, this working group discovered a patchwork of disaster preparedness: While all of our systems had provisioned spare capacity, the provisioning methodology was inconsistent across teams, and only a few teams conducted regular exercises to verify that the provisioned capacity was sufficient to compensate for the sudden loss of a large region.
Our disaster readiness working group agreed on a shared goal:
Every service should be able to sustain the loss of its largest region, without allowing any violations of service-level objectives (SLOs).
If every service met this goal, we reasoned, then our monitoring infrastructure would be resilient to the sudden loss of a large region. Achieving this goal was only slightly more complex: Each team did a (compute/storage) capacity analysis and/or performed load testing on their production systems. After this analysis phase, several teams decided to expand the capacity footprint of their services either to add additional compute/storage capacity to existing regions or to expand the service footprint into new data center regions. It is worth noting that Meta data centers are grouped into correlated fate zones (CFZs), which are collections of regions that have a significant risk of failing simultaneously in the event of a natural disaster or the failure of a shared, underlying resource. As each team expanded its regional footprint, we were careful to distribute capacity across multiple CFZs.
The next step of our disaster readiness plan was to verify that our capacity-planning exercise had been successful by deliberately removing capacity in a simulated region loss. Meta has a rich suite of tools for simulating such scenarios. A graceful drain instructs our sharding infrastructure to redistribute all shards in a particular region to any other region in a matter of minutes. An ungraceful drain injects a network routing error so that all machines in a given region are immediately unreachable (for example, using a system like BellJar). Network unreachability is detected by our sharding infrastructure, which then does shard failover in much the same way as a graceful drain.
Today, each of our monitoring systems executes scripted graceful drains roughly every 30 days. The exact day is chosen by automation, and graceful service drains execute without human intervention. Drains are scheduled for individual services as well as for groups of services simultaneously. The on-call engineers that monitor the health of our monitoring system(s) expect to see no degradations in service quality during these exercises. More importantly, our users expect monitoring services to maintain their SLOs. With rare exceptions, drain exercises have been transparent to our users and have helped to verify that our services are ready to withstand the loss of a large region without degrading service quality. In short, these drain exercises have been overwhelmingly successful.
This readiness was proven again in 2022 when natural gas shortages in Europe threatened the electricity supply of one of our European data centers. During this time we successfully operated some of our largest monitoring systems for multiple days without a large EU data center.
Building Overload Controls
Meta’s software infrastructure is built using a variety of programming languages and deployed in an open ecosystem where systems communicate using RPC frameworks such as Thrift. In this environment, new clients can appear at any time, and workloads can significantly change in a matter of minutes. Because of this, most of Meta’s monitoring systems were designed with overload scenarios in mind. Most commonly, overload would result from a new (or recently changed) client issuing a flood of requests. Our monitoring systems handled these “noisy neighbors” by either implementing per-client admission controls or simply over-provisioning the system.
The 2021 outage taught us, however, that our systems were not prepared for massive thundering-herd problems, where virtually every client system and a majority of human users hit the system in unison within a matter of minutes. Such traffic volumes can overwhelm even the best admission-control systems, and it is cost prohibitive to over-provision for such rare events. Under such extreme workloads, prioritized load shedding is a more effective mechanism for protecting a critical system from meltdown. But this raised important questions:
Are all monitoring workloads equally important? If not, how do we define workload criticality?
Answering these questions is nontrivial. It requires a painstaking analysis of the criticality of data that each monitoring system ingests and the queries that each serves. As a concrete example, how could we determine which time series data was most important in a system that ingests hundreds of billions of time series each minute? Similar questions arose in each of our monitoring systems because each operated at a massive scale, in an open ecosystem where traffic patterns change rapidly.
We are still working on this problem, but we have made meaningful progress. As with most complex problems, we have chosen to divide this one into simpler sub-problems and solve those. For query workloads, our first step was to divide query load into queries issued by automation versus by humans, because while human-issued queries represent a tiny fraction of overall query volume, they are expected to be important. Most often they represent the work of an on-call engineer trying to investigate, debug, or remediate a failing system. These queries are our raison d’etre.
For system-generated queries, which comprise the overwhelming majority of our query volume, we have chosen to categorize them by criticality—initially based on the criticality of the system issuing the queries. Over time, software systems at Meta have been categorized into tiers of criticality. For example:
- Tier-0 systems: Absolutely required to operate our family of apps (Facebook, Instagram, WhatsApp, etc.) or to recover them from an outage. Failure in one of these systems is expected to be user-visible immediately.
- Tier-1 systems: Critical supporting infrastructure, but failure in one of these systems will not immediately cause a user-facing failure.
Lower tiers are similarly described. Leveraging this categorization to derive first-order criticality estimates for incoming queries, we have established a rough taxonomy. Traffic originating from humans or Tier-0 services is most important; the remaining service traffic is categorized based on the criticality of the originating system. This approach has proven remarkably effective because a few Tier 2 and 3 services that are used for non-critical purposes (such as load testing) generate a significant portion of our query workloads. In an emergency, shedding these loads can reduce overall query volume by more than 50 percent.
Monitoring the Monitoring Stack
How do we determine if the monitoring stack is healthy? Monitoring failures are often silent: Alerts that never fired, data that quietly went missing from a dashboard—these silent failures are difficult for humans to detect. Even basic monitoring functions involve multiple systems operated by different on-calls. For example, automatically notifying a human of a system that is running out of memory requires that the monitoring system ingest memory utilization metrics, query them periodically, compare the query results against healthy thresholds, generate a record (alert) of unhealthy utilization, and send out a notification (voice call, SMS) to the engineer responsible for the system. This entire workflow traverses several systems.
Each of these systems is maintained by a team of on-call engineers (called an on-call rotation), but no single on-call rotation considers the entire workflow their purview. How could we encourage shared ownership of the entire workflow?
Our approach was to measure and set goals for the behavior of the end-to-end system. We built an independent system for monitoring the monitoring stack. It’s called MonMon, and its sole purpose is to measure the stuff that is hardest to measure in our monitoring ecosystem. MonMon is an active probing system: It injects synthetic data such as time series or structured logs into production datasets and verifies expected states; for example, that the emitted data is queryable and correct. It also verifies expected actions—creating an alert, notifying an on-call—ensuring that they happen in a timely fashion. In this way, MonMon provides a holistic view of the end-to-end system behavior. MonMon generates end-to-end, service-level indicators (SLIs) for our monitoring stack that help us to understand how systems cooperate. We use these SLIs to iteratively measure and improve the performance of the “weakest link” in each of our end-to-end workflows. The entire system is more resilient as a result.
Building Culture: Resilience as a Shared Value
In addition to our technical work, we knew we had to make changes to the monitoring organization’s culture. Meta’s monitoring infrastructure is a collection of systems that is owned and operated by approximately ten different software teams. In our famously bottom-up culture, these teams are independent and have the freedom to define product roadmaps that meet Meta’s needs for each product. This culture serves us well by empowering engineers to identify feature gaps, reliability problems, and so on, as well as to iteratively deliver solutions. But solving problems that span multiple systems requires building a shared vision for the entire system, not just its constituent parts.
This was exactly the dilemma we faced in improving the resilience of our end-to-end monitoring stack. So the progress made since 2021 has been as much about hacking our culture as about hacking our systems. Our approach is simple but not easy, and includes deliberately and repeatedly embracing resilience to failure as a core part of our organizational mission. We introduce our systems as the eyes and ears of Meta. We reinforce that they should be among the most resilient systems at Meta. And we intentionally recognize engineering work that improves the resilience of our monitoring systems. We so strongly believe these things, that when it came time to name our organization-wide team, we simply called it, “Always be Monitoring.” It’s our home base for organization-wide resilience problems.
The Always-Be-Monitoring Program: Our Culture Shifter
Here’s how our culture-shifting, always-be-monitoring program works:
- Bring together people who care about the problem.
- Talk about the potential problems, and how we should address them.
- Have a “trailblazer” figure out the best way forward.
- Replicate the trailblazing approach (with tweaks) in other teams.
- Repeat until perfect.
V-Teams
We recruited engineers from each of the constituent teams to gather bi-weekly to talk about what needed to be addressed. “Recruit” may not be the right word, because most people volunteered to join the problem with little-to-no prompting. The hardest part was “balancing” the team, so no single product was over-represented. We were targeting groups to be big enough to cover our main services, but small enough to be able to move fast on decisions and actions.
We started with two V-Teams: Disaster Readiness and Overload Protection. Each V-team had between five and 10 people, depending on the phase of the project and the current priorities for the team and organization.
Interestingly, MonMon was a crucial piece of our stack. It was built initially by a few engineers, used and relied on by the organization, but relied on the charity of teams around the organization to keep it running. We’re building a special V-team for this now.
Once the high-level picture was painted, one person would become the project “trailblazer.”
Trailblazers
This person would return to their team and hash out how to implement the new V-team focus for the monitoring systems. During the implementation, they’d get consistent feedback from the rest of the V-team. Once the trailblazer’s implementation was in production and validated, the other teams would start figuring out how to take the learnings from that trailblazer and make their team’s process go faster. For example, our structured log system, Scuba, was the first to implement some of our DR strategies. As other teams needed to improve their DR posture, they’d reach out to the Scuba DR Trailblazer to help build their path forward.
Things We Didn’t Do: External Monitoring
In the immediate aftermath of the 2021 outage, one of the prevailing ideas was to build externally hosted monitoring for Meta infrastructure. The rationale was simple: If Meta infrastructure was failing, the only way to provide always-available monitoring would be to either move all of our monitoring systems to third-party infrastructure or build a separate, scaled-down monitoring system using external infrastructure to provide redundancy for a small subset of workloads.
In the end, we pursued neither of these options. The former would be cost prohibitive and would negate the benefits that Meta derives from building its own hardware and software infrastructure. The latter approach was abandoned because it would be too difficult to determine a priori which data should be replicated, and because an externally hosted system would almost certainly have different user interfaces and feature sets than our internal systems. During a severe outage, we would be more likely to have a redundant system, but our incident responders and on-call engineers would be relatively unfamiliar with the external system, which would make them less effective at diagnosing and mitigating the problem.
Future Work
Our journey towards building more resilient monitoring systems and rebuilding our culture around resiliency as a core value is far from over. Here are some of the areas we’re focused on going forward:
Disaster Readiness: The combination of geopolitical events, like the 2022 energy crisis in Europe, and a seemingly unending stream of destabilizing weather events have taught us that our disaster readiness strategy cannot stop at single-region disaster readiness.
Meta has invested in dozens of data centers over the last decade, and we expect to continue investing for the foreseeable future. In particular we are investing heavily in data center capacity to support AI workloads. This means not only delivering new GPU-based hardware types but also investing in the storage and transport infrastructure to support AI model-training and inference at scale.
As Meta’s data center footprint grows, the likelihood of an outage that affects multiple data centers grows commensurately. Unfortunately, our strategy for single-region outage readiness (provisioning additional buffer capacity and verifying its sufficiency with monthly drains) is not a cost-effective way to deal with multi-region outages. Our teams are currently exploring strategies for using capacity spreading and load shedding to make our monitoring services resilient to multi-region outages.
Better Workload Categorization: We plan to improve the precision of our criticality-based, load-shedding mechanisms. Our current focus is on developing a better understanding of query workloads to ensure that load-shedding controls do not mistakenly drop important queries. To do this, we plan to add criticality metadata to both incoming requests and stored data (for example, labeling tables that are used to analyze global network traffic flow). This metadata will allow us to calculate more representative criticality scores for each query and better identify which traffic can be shed under overload conditions.
Dependency Failure: All software systems are vulnerable to failures triggered by other software systems on which they depend. Software dependencies can develop insidiously and are difficult to track over time. They also vary in criticality: Some dependencies enable core system functions, while others are used in peripheral workflows. We expect Meta’s monitoring systems to be resilient to both the total failure of non-critical dependencies and partial failures of critical systems. To verify that our systems can meet these expectations, we plan to regularly inject varying levels of dependency failures into production systems in order to iteratively measure and improve the resiliency of our systems to software failures.
We’re excited about building monitoring systems that are increasingly resilient. Doing so will lay a foundation for improving the reliability of all of Meta’s infrastructure.

