


As we continue to push the boundaries of AI, the reliability of our networks becomes increasingly important. We will share how we have enhanced the stability and performance of these networks to meet the demanding needs of our AI training workloads.
We will set the stage with an overview of how our networks are structured, focusing on the distinct roles of our networks and their importance in the AI training ecosystem.
Context
Historically, for our traditional workloads we had a multistage topology that we used to manage massive amounts of data efficiently. This architecture is designed to provide high scalability and robust fault tolerance by using a spine-leaf structure. In this setup, all leaf nodes, which enable servers, are interconnected through multiple spines.
Each spine operates with non-blocking, high-bandwidth capabilities to handle the data sent from multiple leaf nodes without performance degradation. Redundancy is a key feature, with multiple paths existing between any two points to ensure continuous availability and service, even if one or more paths fail.
The Frontend Fabric plays a crucial role in the AI training ecosystem. This fabric is designed to efficiently accommodate data ingestion, ensuring that the data is readily available for processing in the AI training phase. Additionally, it supports the initialization and management of the communication libraries.
By optimizing data ingestion and control traffic, the Frontend Fabric facilitates a seamless, efficient pipeline that enhances the overall performance of AI training processes.

And while that front-end excels for general-use computing needs, in the realm of AI training, given the unique requirements of these operations—which involve intensive data processing and real-time sharing across multiple GPUs—we need a separate backend network dedicated to GPU-to-GPU communications.
AI models, particularly deep-learning frameworks, require significant computational power and the ability to handle vast datasets. By segregating GPU-to-GPU comms onto a dedicated backend, we ensure that these high-bandwidth, low-latency interactions are optimized.
We minimize the risk of bottlenecks that would happen if GPU comms were to share the same network infrastructure used for other data center traffic. By isolating this traffic, managing and monitoring the network performance is easier. It helps maintain consistent performance levels and reduces the likelihood of disruptions caused by congestion or faults in the broader data center network.
Another benefit is that a dedicated network can be specifically tailored with advanced platforms and protocols that are best suited for high-performance computing (HPC) scenarios, further optimizing the data flow between GPUs.
To sum up, these two networks are designed to cater to a broad spectrum of computing needs.
Together, these two distinct yet complementary fabrics form a comprehensive data center solution. The Frontend Fabric offers robust and adaptable capabilities for general applications, while the Backend Fabric provides a specialized, high-performance environment tailored for the demanding needs of AI training.
Hopefully this provides a bit of color on how our networks are set up. Now let’s dive into challenges in ensuring the reliability of the space.
Challenges

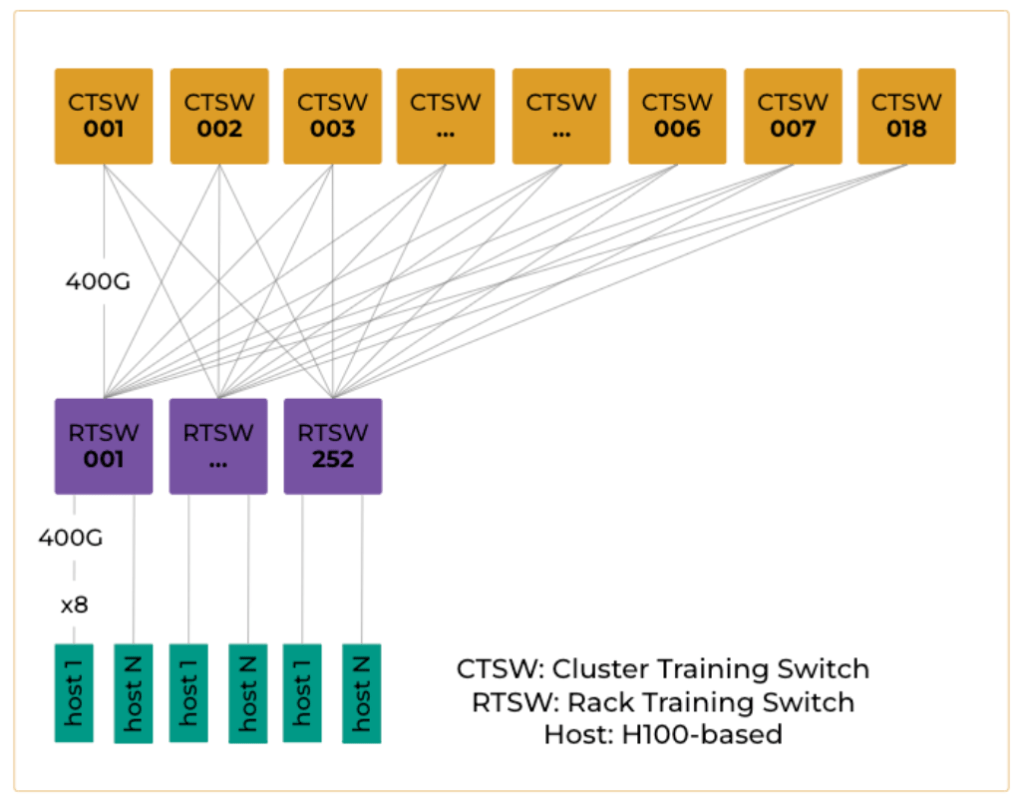
Figure 3 represents an overview of our first-generation, backend topology. This design incorporates a two-stage Clos. Here, the GPU hosts are connected to leaf nodes, while the interconnectivity between the leaf nodes is provided by the spine layer. The leaf switch, known as the RTSW (Rack Training Switch), resides within the AI rack alongside two supernodes, and it connects to 16 GPUs through DAC (direct-attach copper) cables. On the uplink side, the RTSW is connected to 18 CTSW using single-mode fibers. The network has an overall under-subscription ratio of 1:1.25. This topology enables the support of up to 252 AI racks, accommodating a total of 4K GPUs within the AI zone.
To ensure the reliability of the training jobs, it is essential to have a robust system in place for the rapid detection, triage, and mitigation of any failures. Any failure of a CTSW will affect 1/18 of the all rack traffic. Upon detecting the failure, the system should immediately trigger an alert for automation, which should then quickly assess the extent of the impact and execute any potential mitigation. Ideally, the system should automatically reroute traffic to minimize disruption to the ongoing training jobs, leveraging redundant pathways in the design to maintain connectivity and performance.
In managing our network infra, we face several challenges that require strong strategies and proactive measures:
- Observability: Our performance and reliability hinge on our ability to observe a wide array of metrics effectively. Challenges arise from packet loss, particularly on the backend network, which can lead to significant performance regression and QPS (queries per second) degradation. Hardware-related issues such as FPGA (field-programmable gate array) or ASIC (application-specific integrated circuit) errors and routing inconsistencies also present substantial hurdles. Additionally, keeping track of platform health metrics such as memory, storage, CPU, temperature, and component failures demands a robust monitoring system. These observability challenges necessitate a comprehensive approach to ensure potential failures are identified and addressed quickly.
- Triage: Now, with the extensive data collected from our monitoring systems, we encounter the challenge of uber-visibility, where the volume of detections can be overwhelming. The key difficulty lies in efficiently framing these signals to identify the most probable root causes without relying solely on manual triage. This process must be supported by statistical analysis and specific metric snapshots, which require collaboration between our teams and external vendors. Achieving fast and accurate triage is crucial for a timely issue resolution and maintaining network integrity.
- Capacity Impact: Last, we have capacity impact, where balancing capacity with reliability presents its own set of challenges. While our frontend network is generally overprovisioned to prevent service impacts, the backend network directly ties capacity to performance. Any loss in capacity on the backend can drastically impact QPS and lead to potential job failures. Proactively managing these failures involves draining devices and circuits that show signs of degradation. This careful management of capacity and reliability is essential to sustain the robustness of our network and support continuous and efficient service delivery.
It’s worth noting that these challenges are common to the frontend and backend networks, but the non-blocking and latency-sensitive needs of the AI training clusters have been a forcing function—pushing our teams to evolve and scale our solutions to keep up with the pace of AI developments.
Improvement Strategies
To evolve our approach to network monitoring and repair, we focused on three strategic themes designed to enhance efficiency and reliability across our space:
- Integrated Monitoring: The first theme involves implementing a monitoring strategy that combines passive and active techniques. By integrating these methods with contextual data, we enhance visibility and identify service-level impacts more effectively. This holistic view allows us to detect and address issues proactively, ensuring that network operations maintain a high level of performance and reliability.
- Enhanced Triage: In the second theme, we focus on refining our triage process. By implementing context-aware monitoring that provides granularity at the data center, pod, rack, and device scopes, we can better correlate detections across different areas of the DC network. This enhanced correlation is crucial for quickly and accurately pinpointing the root causes of issues. By streamlining this process, we minimize downtime and improve the precision of our diagnostic efforts.
- Rapid Repair: The final theme centers on expediting the repair process. Once a precise root cause is identified and a repair action is initiated, our goal is to have strict SLOs (service-level objectives) that focuses on minimizing the time required to return affected network capacity to service. This rapid response capability is key to maintaining the resilience and efficiency, ensuring the network is highly available.
Integrated Monitoring
Let’s talk about integrated monitoring and what it means in the data center space at Meta:
Passive monitoring is a traditional approach in instrumentation that involves detecting, triaging, and alarming based on events and counters “on-box.” The sources for these collections include standard or vendor-specific counters, log patterns, and custom commands. We run a heterogeneous network, which means we have a mix of Meta and vendor hardware platforms—and this is a pain point in the end, so we have a custom agent that unifies our approach to traditional monitoring. Data collection occurs on the device and across the network, facilitating aggregate alerting and real-time trending. Our on-box platform enhances monitoring by enabling combinatorial detections and lookback windows. This capability significantly reduces noise, allowing for more precise alerts—for example, indicating a line-card failure instead of triggering multiple alerts for each port and protocol event that was generated by the fault.
Active monitoring plays a crucial role when passive methods fall short, particularly when devices fail to self-report issues. This method provides a constant, clear baseline for packet loss and latency, essential for ensuring network integrity. It involves using probes to measure loss in the network via distributed measurement agents across the fleet. These agents perform failure triangulation and provide aggregated data at various network scopes such as rack, pod, and AI zone levels. Ultimately, active monitoring offers a holistic view of network health, catching problems that might be overlooked by per-device passive monitoring.
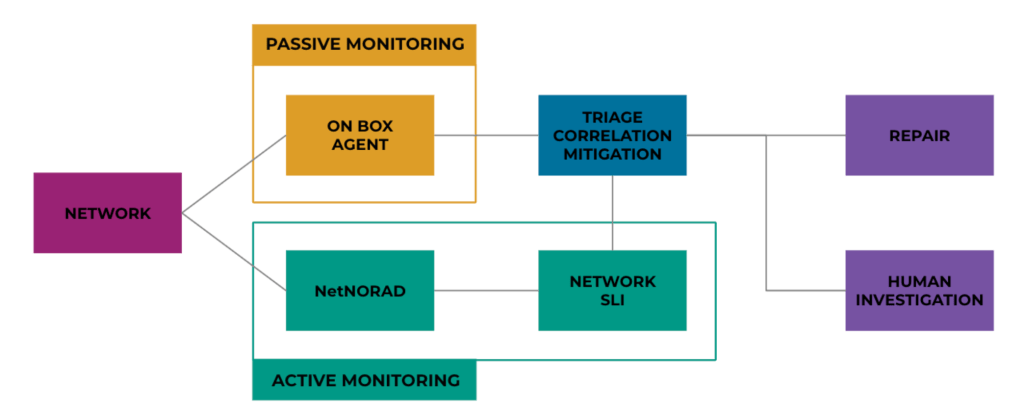
To further enhance our performance and reliability, we have integrated advanced tools such as NetNORAD, our foundational network active probing solution, and our Network SLI (service-level indicator) program into our monitoring framework. This integration is designed to detect and address increased loss within our AI zones.
By merging active and passive monitoring, we create a robust system that leverages the strengths of each method. NetNORAD has proven effective in identifying issues within our backend networks, while the Network SLI program provides high-signal events that indicate specific areas needing attention. This combination allows for a comprehensive view of health, enabling us to detect a broader range of issues, from immediate failures to subtle performance degradations.
Our approach to measuring reliability involves analyzing performance based on good and bad minutes, evaluated against established reliability thresholds. This method allows us to identify the root causes for not just rack-level loss among hosts within the same rack but also cluster-level loss among hosts in different racks, providing a detailed understanding of performance across various scopes and of which failures matter most.
Each detected event, categorized by periods of bad minutes, is analyzed with data collected from instrumentation and our advanced tools. By continuously feeding and refining these systems with new data, we improve the signal quality and enhance our ability to detect and address issues more effectively. Additionally, this process helps identify any gaps in our current monitoring approaches, guiding future enhancements to ensure our network remains resilient and efficient.
Enhanced Triage
Even with the noise-reduction features provided by the on-box monitoring agent, which reduce false-positives, we still end up with thousands of distinct events from devices in every layer of the network.
We have to correlate distinct events and collapse them, which reduces noise and increases our ability to act on the proper failing element.
This approach involves collecting and analyzing detailed events from various network components and running them through a correlation engine. The events are organized via a topology model and this context is used to establish relationships between different distinct events and anomalies. The events then enter into a correlation time window, and the engine bundles related events into a single case with a suggested root cause. This correlation process has been very effective here at Meta—we typically see a ratio of 250:1—which means for every 1000 detections, we’ll collapse those into four distinct problems.
Per the example below, we have a failing fabric switch which is generating multiple upstream/downstream faults that would be difficult to diagnose if they were uncorrelated. The correlation engine assigns only the related faults to a single case and assigns a problem-type of fabric-switch failure. Once the primary problem has been established, we can auto-triage the root cause, or if required we do a more complex manual triage.

Network snapshots
To enhance our manual triage processes, we built a system that captures detailed snapshots of the on-box state immediately after an issue is detected. This system is a crucial component of our management strategy, providing deep insights into the network’s operational state during incidents.
At the core of our approach is an on-box agent specifically designed to quickly capture comprehensive snapshots of logs, system counters, routing states, and vendor-specific debug information, ensuring that we preserve the exact state of the device at the time of the incident. By maintaining these detailed snapshots, we avoid the time-consuming challenge of state duplication, where the relevant data might otherwise be lost or overwritten before analysis.
These snapshots are integrated into internal and external triage pipelines; when a network device fails, the captured data is automatically linked to the generated tickets, providing our engineers and external vendor support teams with immediate access to the relevant diagnostic information. Vendors can access the detailed snapshots directly through the system, allowing them to quickly understand the issue and expedite the replacement of faulty equipment. This seamless access not only speeds up the resolution process but also enhances collaboration with our hardware vendors, ensuring that network uptime and performance are maximized.
Rapid Repair
As we move to repair, it’s essential to consider that setting SLOs is just the beginning, not the end. The actual value of SLOs is realized when they are used to drive enhancements in automation and design. This approach ensures that SLOs are not just theoretical targets but practical tools that actively guide and improve our automation strategies. They should be actionable, providing clear directives for automating processes and refining system responses. Without this focus on automation, setting SLOs can drive fatigue and reward manual heroics, instead of driving meaningful improvements to operational efficiency or effectiveness.
The practicality and utility of SLOs heavily depend on our ability to measure and analyze them quickly and accurately. Their effectiveness is significantly compromised if we struggle to quantify or interpret these objectives efficiently. For instance, consider the time-to-repair (TTR) metric, which is straightforward to measure and critical for driving operational improvements. TTR offers clear insights into the average time required to repair a network element, directly indicating reliability and maintenance efficiency. It can also be broken down into its subcomponents for analysis, but the simplicity of focusing on the end-to-end TTR as an SLO is what drives action and focus.
Results and Observations
We have observed significant enhancements across every aspect of the pipeline we previously outlined, achieving consistent models for detection, triage, mitigation, and repair across our diverse platforms. This progress, coupled with our work on Reliability SLIs, has enabled us to uncover patterns and opportunities for improvement that were previously unrecognized or unsupported by concrete data.
Our analysis has revealed that not all failures impact our workloads equally. Data from our triage and SLI processes have highlighted the specific issues that most significantly affect our AI workloads, allowing us to strategically allocate resources to enhance developer experience effectively. For instance, we found that port events have a disproportionately large impact compared to other problem types, by orders of magnitude. This insight has directed our focus towards exploring and addressing these critical issues more intensively.

We’ve also been able to better manage systemic issues such as repeat offenders and the visualization of sporadic “slow-burn” problems. This approach has driven us to identify and address root causes that were not immediately apparent but consistently drained data center resources, disabled network capacity, and often resulted in “no-fault-found” diagnostics. This was particularly evident with issues related to optics and certain temperature anomalies.
Lastly, the emphasis on reducing our time to repair (TTR) has been pivotal. By consistently meeting and improving our SLO targets over time, we’ve transformed network failures from major performance setbacks into minor inconveniences that can be swiftly managed at higher layers. The diligent tracking, refinement, and consistency of our repair processes have visibly enhanced how our customers experience the AI network, underscoring the critical role of efficient repair strategies in maintaining network availability and user satisfaction.
Future considerations
Implementing active monitoring for application-level anomalies, such as bit-flips, is crucial. These subtle issues can cause significant data corruption and system errors, often escalating unnoticed into larger problems.
Improving the accuracy of our triage processes is essential, especially in scenarios with extended repair timelines like RMA situations. Enhancing the precision of our initial assessments can streamline the repair process significantly.
To further enhance our capabilities, we plan to expand our network monitoring tool, NetSLI, to cover broader network scopes and include latency-aware features. This expansion will significantly improve our ability to detect and respond to network issues swiftly and accurately.
Conclusions
To summarize, integrating AI training workloads into data centers has significantly raised demands on reliability and performance, particularly on bandwidth, latency, and loss. The increased reliance on GPUs highlights the need for robust operations to support the AI training jobs, with a strong emphasis on continually enhancing operational standards and optimizing key parameters to prevent bottlenecks and potential failures.
Meta has exceeded reliability targets for AI applications, mainly due to bespoke in-house solutions. This success highlights the effectiveness of custom solutions tailored to meet specific operational needs and set new reliability benchmarks. As technology and demands evolve, there is a continuous need to adapt and innovate. Staying competitive in this dynamic environment requires ongoing research and development to ensure our solutions are scalable and adaptable for future advancements and challenges.
This proactive approach to technological adaptation is vital for maintaining high performance and reliability as demands evolve. By continuously improving our infrastructure and solutions, we ensure our data centers can handle the increasing demands of GPU workloads and other advanced applications, maintaining operational excellence and effectively supporting critical functions.
Thanks for reading!

