


At Meta, ensuring the reliability of products and services is a top priority. Achieving our company mission of giving people the power to build community and bring the world closer together depends directly on our systems’ uptime. We are constantly improving our products and services with new features and capabilities. We must ensure that deployments and changes can go out to production safely and without issue, especially within the context of our fast-paced environment.
Multiple layers of protection at Meta prevent outages caused by bad changes pushed to production. We run unit, integration, end-to-end, and performance tests. As changes reach the final stage of readiness for production, we have one final critical stage where we validate their safety. During this stage, we use something we refer to as “health checks.”
Deployment health checks are an essential component of our change-safety infrastructure, allowing us to evaluate the health of our systems and discover issues before they become major problems. By continuously monitoring system metrics during rollout, we can identify and address potential issues early on, reducing the risk of outages and improving overall service reliability.
In this blog post, we will delve into various aspects of health-check quality, the challenges we faced while integrating health checks into the deployment process, and the steps we took to address them. We will also share our vision for the future of health checks and how they fit into our broader efforts to improve our infrastructure reliability.
Deployments
Before we dive into health checks and how they help us maintain high-reliability standards, we’ll quickly describe the deployment process.
Thousands of different systems, services, libraries, and products at Meta are changed every day. Among them, they have different topologies, architectures, modes of operation, and guarantees. It’s fair to assume that we can’t have a single, one-size-fits-all strategy for how to roll out changes, in part due to potential differences in the changes themselves—for example, code changes versus configuration ones. That, however, doesn’t change our main priority: Safety is not optional. No matter what is going to be updated or how exactly we update it, we have to ensure the deployment won’t lead to reliability regressions.
Every deployment system and each deployment itself (see Figure 1) follows the principles below to ensure its safety. (We are going to concentrate on deployment workflow and will skip other common and important aspects of shipping changes such as unit and integration testing, performance testing, etc.)

Deployment Principles
- Tiered rollouts. Ideally, we’d like to catch issues as early as possible and avoid affecting our production. At Meta, we use various techniques to set up a pre-production environment (for example, by using traffic shadowing to Release Candidate (RC) tier). Having such tiers will help to avoid problems in the production environment and, at the same time, evaluate the basic quality of new deployments. Of course, it’s often impossible to create environments identical to production environments—especially for large-scale systems.
- Phased rollouts, at least for production tiers. Billions of people use Meta products. It is critical that we avoid large outages in production. Tiered rollouts are divided into separate phases, with each phase partially updating one or more regions. This strategy allows us to track how deployment affects our systems and catch potential regression during the early rollout phases.
Sounds like a smooth and simple workflow, right? In practice, however, there is a trade-off: shipping changes as fast as possible versus shipping changes with maximal safety and minimum manual interaction with owners. At the same time, we’d like to detect different kinds of regressions—from obvious system crashes to slow regressions during which it’s not clear if we’re facing a transient issue or one that will become a bigger problem. Complicating matters, we have a limited time period to discover these things. The more time discovery takes, the more problems stack up:
- Other systems are getting updated, and that might negatively affect current deployment.
- Different kinds of updates can be rolled out to the same system.
- System owners and/or partners are waiting for the change being pushed.
Let’s dive into how we solve these problems and prevent changes to Meta systems from degrading reliability.
System Health and Health Checks
Each system at Meta has its own unique health-check configuration that defines the metrics and thresholds used to determine its health.
Systems at Meta are bootstrapped with out-of-the-box metrics to provide a baseline level of health-check coverage. These metrics include common indicators such as CPU usage, memory utilization, crashes, categorized error ratios, and more. The idea behind these out-of-the-box checks is that every system should have a default safety mechanism. We carefully selected metrics that cover different kinds of issues and reflect service-level-indicator (SLI) behavior as much as possible. Of course, every system differs from another, and sometimes it’s not enough to have only default checks. To improve reliability, system owners can add their own custom health-check metrics, which are typically application-specific metrics such as latencies for critical dependencies or overall request cost.
Health checks themselves have several main components, as illustrated in Figure 2.

Those components are:
- Health-check metrics defined in a query-language format that yields time-series data points when fetched (see Figure 2 above). Each data point contains a timestamp and a value. When evaluated alongside the other components, these data points determine the result of the health check. Metrics themselves are templated in a way that allows dynamic insertion of specific test and control groups during evaluation. For example, we may push a change to a subset of hosts and then compare the metric for those hosts to other hosts that have not received the change.
Templating is a key component of our system. Every deployment system at Meta performs rollouts related to their own abstractions. Additionally, system owners typically are not aware of deployment complexity, and all they care about is system metrics and how to catch potential reliability issues. Service health hides this complexity from both deployment systems and system owners and performs dimensional transformations behind the scenes to discover the most optimal way, depending on the current state of deployment, to check the metric. Accurate metric targeting is a critical element of having a high-quality, change-safety mechanism. It allows us to check metrics published by the exact part of the system going through updates without potential inference from a stable environment.
- Thresholds, which define where the bar is for a pass or fail result. Each threshold contains lower and upper bounds identifying when the system is healthy. Additionally, thresholds can be defined to cause a failure result where there is no data returned during metric data fetching. Pass percentage allows for a fraction of the data points to be outside the bounds of the threshold and gives finer-grained control to overcome possible noise in a metric. Last but not least, we have a variety of thresholds to match different stages of deployments and improve the quality of checks. Examples of different threshold types include
- Static thresholds: The simplest type, capturing metrics that won’t go outside the window.
- Comparison thresholds: Static thresholds might be efficient in catching significant issues, but they don’t work well with slow-burn regressions or traffic-dependent situations. For these scenarios, we have a variety of comparison thresholds that help to compare metrics between updated parts of the service and those having stable versions. Based on our analysis, comparison threshold types catch regressions way better than static thresholds and require less maintenance.
- Workflow selection, which is the capability of health checks to be executed on particular phases or types of deployment (for example, only on the production phase, because the RC phase will be too noisy and won’t create a reliable signal). Workflow selection is used when a service owner wants to have more control over which parts of the deployment pipeline run or skip a specific health check. It helps system owners check only the most important and meaningful things at particular deployment phases.
These components all come together to define health checks, which will look something like the following:

Deployment systems are tightly integrated with Service Health Checker (SHC), our health-check evaluation service. During a deployment, SHC receives a request to evaluate the health of the part of the system going through an update. SHC then runs the configured health checks and returns the results for the pipeline to take further action.
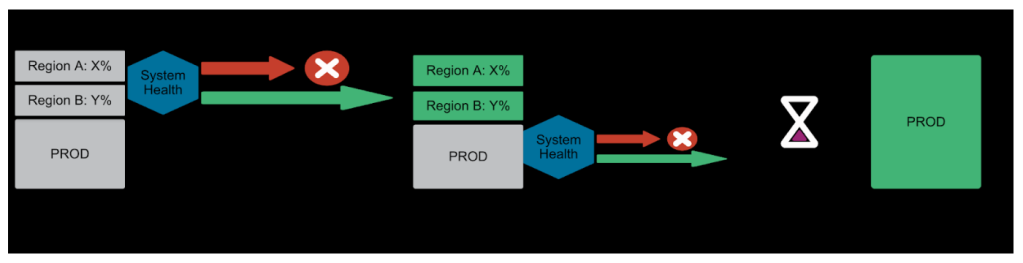
If SHC detects regression, the deployment system rolls back to the previous version or pauses the pipeline, depending on the deployment strategy (see Figure 3). System owners receive a notification to investigate what’s going on. This ensures that any issues are caught early on, reducing the risk of widespread outages or reliability regressions.
System owners can understand the current state of their service by consulting dashboards that offer a breakdown of a service’s individual parts and how those are passing or failing health checks at a current moment in time. The dashboard displays time-series metrics along with metadata associated with the health-check evaluation result, helping teams quickly identify and address any issues.
Problems and Challenges
Our mission is to ensure we can catch regressions caused by changes without introducing additional burdens to system owners, such as
- Is the health-check setup good enough to catch regressions?
- How many false alarms do we create?
- What’s happening with the health-check setup over time?
Noisy health checks can be caused by a variety of factors, including
- Overly sensitive thresholds: If the thresholds for a health check are set too low, even minor fluctuations in metrics can trigger an alert.
- Insufficient data: If there isn’t enough data to accurately evaluate the health of a service, health checks may fire unnecessarily.
- Dependency failures: If a service has flaky dependencies or if there is an ongoing outage in a dependency, health checks may fire due to issues with those dependencies rather than the service itself.
Noisy health checks can have serious consequences for our teams and services. The most significant consequences include
- Alert fatigue: When health checks fire frequently but don’t indicate a real problem, teams lose trust in their health checks and may start to ignore them, leading to overlooking real issues.
- Deployment delays: Noisy health checks can pause deployments unnecessarily, causing delays and affecting release velocity.
- Increased on-call burden: Noisy health checks can lead to increased on-call burden, as teams spend more time investigating false alarms.
If we concentrate on fixing noise only, however, it’s easy to miss actual regressions. Basically there’s a trade-off between catching regressions and being too noisy, but that trade-off is complicated by what they have in common: Both can be affected by metric evolution. Systems are changed on a daily basis, and it’s natural to expect that metric behavior can change, so that what is considered healthy today might look unhealthy tomorrow and vice versa. In the next section we’ll touch on how we improve the quality of health checks.
Solutions and Improvements
At Meta, we always care about the reliability of our products and systems. Yet over the last decade, everything has skyrocketed, including the
- Number of people using our products,
- Complexity and number of systems—their scale
- Blast radius of outage
To maintain and constantly improve our own reliability, we need to evolve deployment and change-safety systems—and they have to be smarter and require less and less from system owners. Let’s recap what we did recently to improve deployment safety.
Health-check quality
One key approach we now take to reduce noise is to continuously work with service owners to review and update their health-check configurations, ensuring that thresholds are set appropriately and that checks are properly tuned. To improve the process, we’ve developed new tools to help service owners refine their health-check configurations and provide them with an overview of health-check quality.
We have a data pipeline (see Figure 4) that combines signals from the deployment mechanisms and the health check runs themselves to produce daily, quality metrics about individual health checks. Service owners can see these results plotted over time and take actions based on this data to improve their health checks.
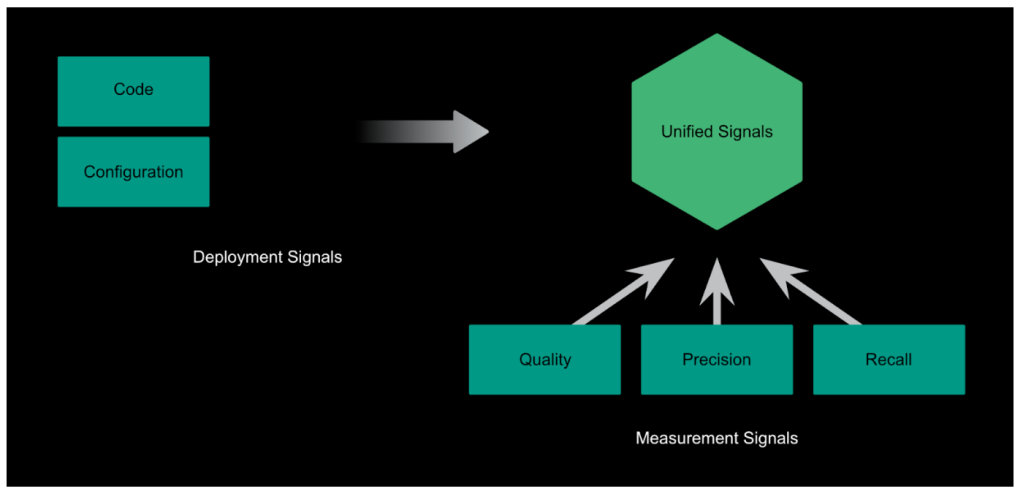
We provide service owners with a catalog of the checks they own. Alongside this, we label the checks based on their quality so that service owners can immediately see problematic checks at a glance. While we use several quality indicators, the primary way we flag low-quality checks is by their noisiness, or false-positive rate. Heuristics are in place based on explicit and implicit signals to categorize health-check failures as true positives or false positives. We weave these annotations into our dataset and use them to calculate the false positive ratio for a given health check.
We leverage precision and recall as a means of gauging the overall quality of checks.
- Precision: a measure of how well the health check detects real issues
- Recall: a measure of the amount of real issues caught
The strategy to reduce noise often boils down to changing the metric used, or tweaking the thresholds. In both cases, we provide tooling for service owners to rapidly prototype and iterate on their health checks to produce a more ideal trade-off between precision and recall.
Service owners can craft new queries for their checks in an easy-to-understand way and layer on appropriate thresholds. Throughout this iteration process, we provide service owners with backtested results (as illustrated in Figure 5) to give them a measure of how well the checks are catching known historical issues.

Aside from false-positive rates, we analyze health checks for best practices during check authoring, and continuously revisit our out-of-the-box defaults, updating them to provide better company-wide coverage. When best-practice violations are found, we flag this to check owners and encourage them to take action to adhere to the latest change-safety guidelines.
We’ve emphasized the importance of collaboration and knowledge sharing across teams. We’ve also established an internal community where teams can learn about best practices, discuss challenges, and work together to develop new solutions.
Last, we’ve developed training programs and documentation to help service owners better understand health checks and how to optimize them. By sharing knowledge and expertise, we’re working to create a culture of health-check excellence across Meta.
Decision-making process
In addition to improving health checks directly, we look at the problem from a different angle—how can we improve precision and recall behind the scenes and not ask owners to do anything? Here are few things worth mentioning:
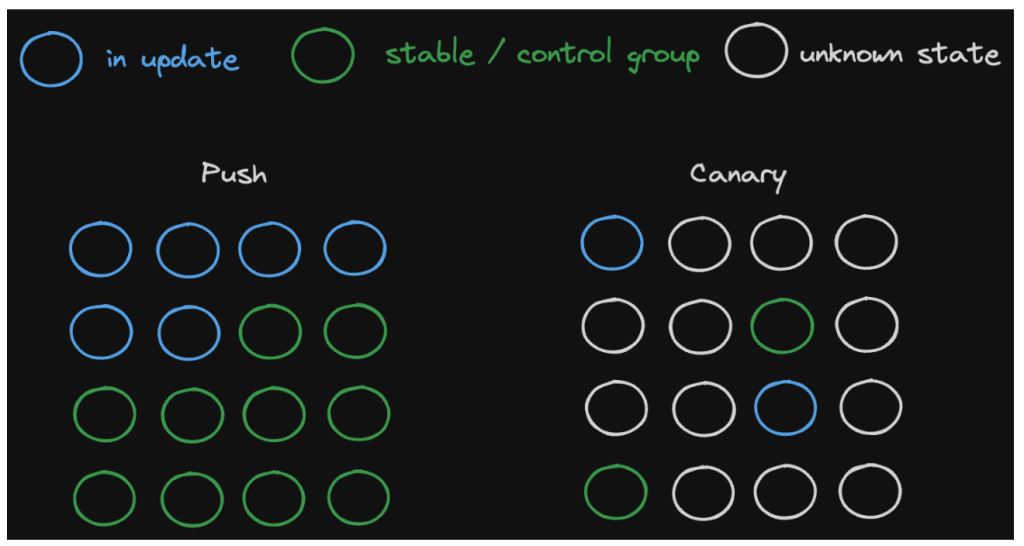
- Coming up with deployment topology allows us to strike a good balance between our scale and health-check coverage by publishing the right number of metrics for the right types of deployment abstractions. Accurate metric targeting (see Figure 6) is key to discovering regressions as early as possible.
- To improve confidence in our decision, we are exploring different ways of evaluating how bad a health-check failure is: how the threshold was violated, and how many parts of the service were affected. Incorporating this into our deployment strategy will help us make more advanced decisions, such as to take more time and continue with the next phase of the rollout or stop immediately because metrics are drastically affected.
- System change can affect many upstream and downstream dependencies, and it’s not possible for system owners to ensure that a rollout isn’t going to affect them. In addition to using current-system health checks during deployment, we discover critical dependencies for the service—a dataset based on our analysis of how systems affect each other and correlate with outages—and perform health checks for those, thereby isolating the most frequently used routing targets. This approach allows us to ensure that a rollout won’t negatively affect the reliability of dependent systems.
- Our main goal, again, is to avoid reliability regressions. And while we try to accomplish that by using available metrics on symptoms, that’s not always possible. So we’ve developed a simple way for every system to easily create health checks based on their service level indicators (SLIs), and for a deployment to be stopped when those SLIs start to regress.
What’s Next?
One of the most significant trends in health checks is the increasing use of artificial intelligence (AI) and machine learning (ML). By leveraging AI and ML, we can analyze vast amounts of data, identify patterns, and make predictions about service health. We’re already exploring the use of AI-powered health checks, which can learn from historical data and adapt to changing conditions. This should enable us to detect anomalies and predict potential issues before they occur. It applies to both metrics evolution and discovery, as well as to our own heuristics, all of which allow us to track the efficiency of particular metrics over time in terms of precision and recall. Our north star is to create a fully automated, self-tuning setup for every system.
We’re investing in distributed tracing tools that provide end-to-end visibility, allowing us to quickly identify bottlenecks and troubleshoot issues. This approach will enable us to improve service reliability and reduce mean time to recovery.
Our ultimate goal is to prevent all production outages while minimizing the time it takes to ship changes to production.
