


Introduction
The RTC Observability team at Meta aims to create a highly reliable analytics platform that provides visibility into call performance, powers top-line dashboards and metrics, and makes available logs that are critical for debugging the RTC platform that powers calling for hundreds of millions of users daily across several different apps such as Messenger, Instagram, and Oculus. Our top priorities are to ensure the privacy of user data and to balance reliability and efficiency of logging, as well as to make partner onboarding smoother.
Call debugging is a particularly important requirement for operating the RTC platform efficiently and effectively. Appropriate tooling to enable engineers to quickly identify the root causes of specific issues as well as perform real-time analysis across large quantities of calls is a must. The following blog post will provide a glimpse into the evolution of such tooling at Meta. Specifically, we’ll look at issues posed by the segregation of logging and a novel real-time data-aggregation solution we developed to resolve those issues.
Logging
The main data source powering debugging is logging. All of the entities involved in a call generate logs. We have different types of logging that can be classified into the following categories:
- Structured events: fire-and-forget schematized events
- Quick-performance logs (QPL): QPLs funnel instrumentation of call flows to measure performance and latencies
- Console logs: lightweight arbitrary debugging information and error messages
- Time series logs (TSLogs): media-quality data in time series format throughout the call
For efficiency, we attempt to utilize Meta’s standard logging platform as much as possible. The standard logging platform mainly supports schematized logs. Log schemas are simple, consisting of field name and value type for the value. Eventually, all of the different types of logs are transformed into schematized logs to leverage the platform. For example, time series logs are transformed into a schematized log by having a field with a string type where all the content of the original log is stored as a base64 encoded string.
It is also important to note that there are different types of structured-event logs. For example, clients emit a connection_start event at the start of the call, a call_summary event at the end of the call, and numerous others during the call. All in all, we end up with dozens of different types of schematized logs.
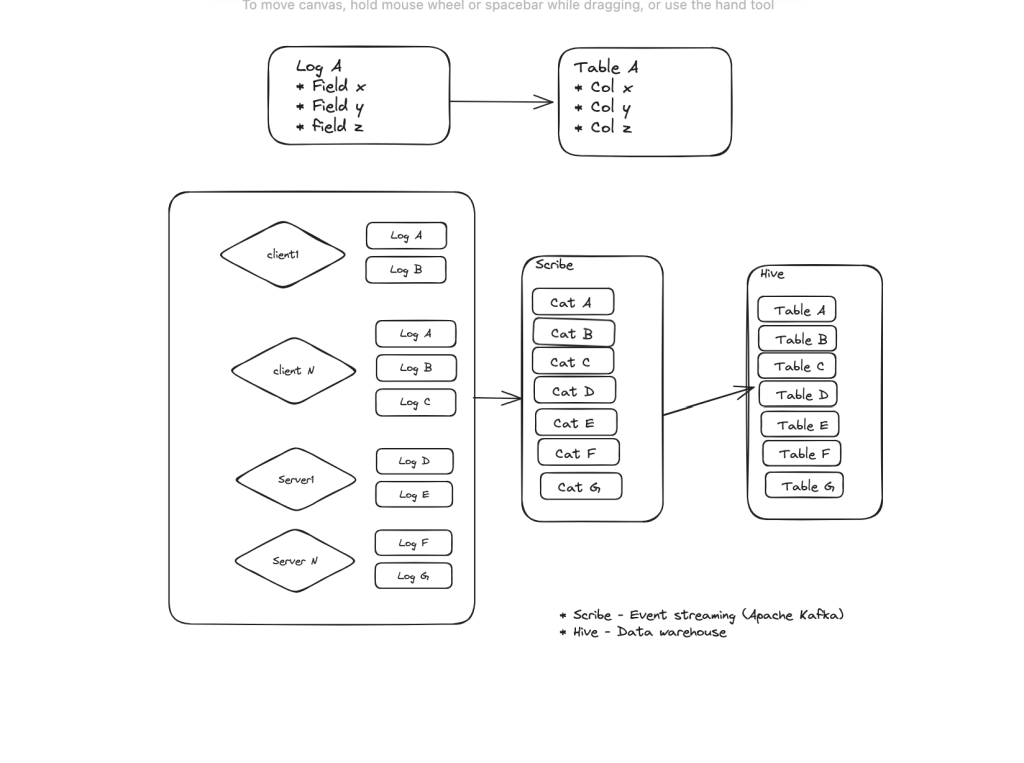
As part of the standard logging infra, all schematized logs are first logged to Scribe. Scribe is Meta’s distributed event-streaming platform, similar to Apache Kafka. From here these log events are streamed into Meta’s data warehouse Hive. There is one-to-one mapping between log type and a data warehouse table. A log field maps one-to-one with a database table.
Tooling
Call Dive: Single-call debugging
Initially, in order to debug issues, engineers utilized standard warehouse tooling to query log data. This became tiring quickly, as there are dozens of tables involved in carrying out a single call investigation. It also adds a great deal of friction when onboarding new engineers, as they have to learn and memorize the names and associated data stored in the different types of tables. Additionally, there is no support for custom visualization of things such as time series data. As a natural response, a custom tool called Call Dive was developed. Call Dive has a visual interface where users are presented with an overview of all logs involving the call. They can click on a log to look into the log data. In addition, depending on the log type, it can provide custom visualizations.

This was definitely an upgrade. However, several key pain points remained unaddressed. Since Hive is a data warehouse, it is not designed to support a low-latency backend for UI tools. P90 log fetch latency can happen in minutes, and as we need to make dozens of requests to fetch logs to render the UI for a single call, there is a high likelihood of hitting P90 latencies. The initial page load for the Call Dive UI requires having access to all logs, causing it to be extremely slow.
In addition, there is considerable delay between when data arrives in Scribe to when it lands in Hive. Though this has improved over time, it would often take multiple hours. Engineers would need to wait hours after an issue was reported before they could investigate and fix the issue. This delay could be further amplified due to the human elements. Engineers could get involved in other tasks in the meantime and might not return to the issue for an extended period.
Furthermore, analyzing logs is critical for development and test cycles. For a distributed system, often it is the only way to develop and test. Due to the slow feedback loop, Call Dive could not fully realize its full potential for this use case.
Real-time data analysis
In addition to being able to deep dive into a single call, there is also a need to perform a rapid analysis on a large number of calls. The RTC platform at Meta has numerous dependencies on infra shared among RTC server components and many client versions across many different products in the wild. This coupled with Meta’s continuous-deployment model and large user base leads to an environment where problems are reported frequently and can arise unexpectedly. Thus, to determine the impact of a reported issue and prioritize our response, we often need tools to perform real-time data analyses on large quantities of data. Additionally, a trends analysis needs to be performed to isolate issues that are specific to certain products and versions and correlate the change in trends with deployment of any of the numerous components of the system. Fortunately, this problem is not unique to RTC and is shared by many teams across the company, and there already exists standard tooling to address it.
Since these tools are part of the shared infra, support can be enabled by a simple configuration change. The tools can then stream logging data from Scribe, similar to the way it’s streamed from Hive, and write to their own specific backend databases. Again, there is one-to-one mapping between a log type and the tables in these databases. In contrast with using Hive, the data is generally read in real time and is sampled to optimize for its specific use cases. One limitation of some of these backends, however, is that they do not support joins between tables. Thus, the engineers could not use them to perform analyses requiring data from different types of logs, which is often necessary. Similar to scenarios involving Hive,even when an analysis did not require data from multiple tables, the engineers still had to deal with the cognitive load of remembering the names of different log types and the data they stored in order to conduct investigations.
RAlligator: Real-time log aggregation
The key root cause impacting the useability of both real-time analysis tools and Call Dive is segregation of different log types. So we devised a new system called RAlligator (short for real-time log aggregation) to address this fundamental problem.
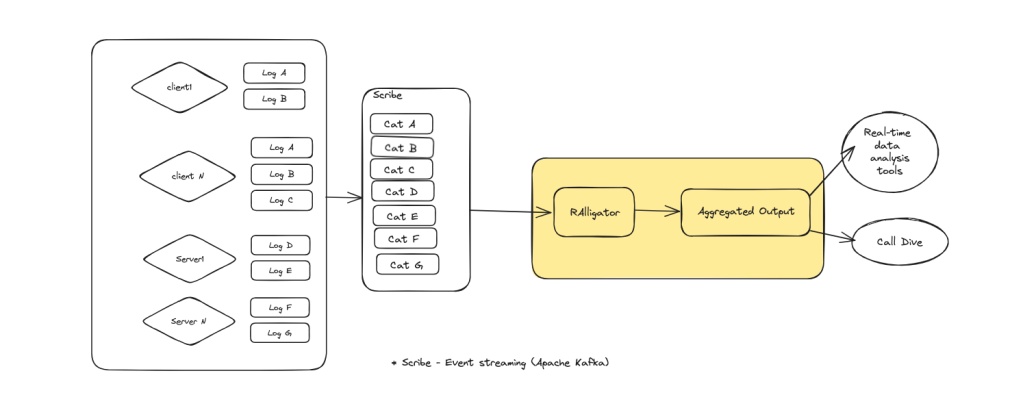
RAlligator is designed to leverage the existing logging as much as possible. It reads data from Scribe and produces aggregated outputs for both Call Dive and real-time data-analysis tooling to consume.
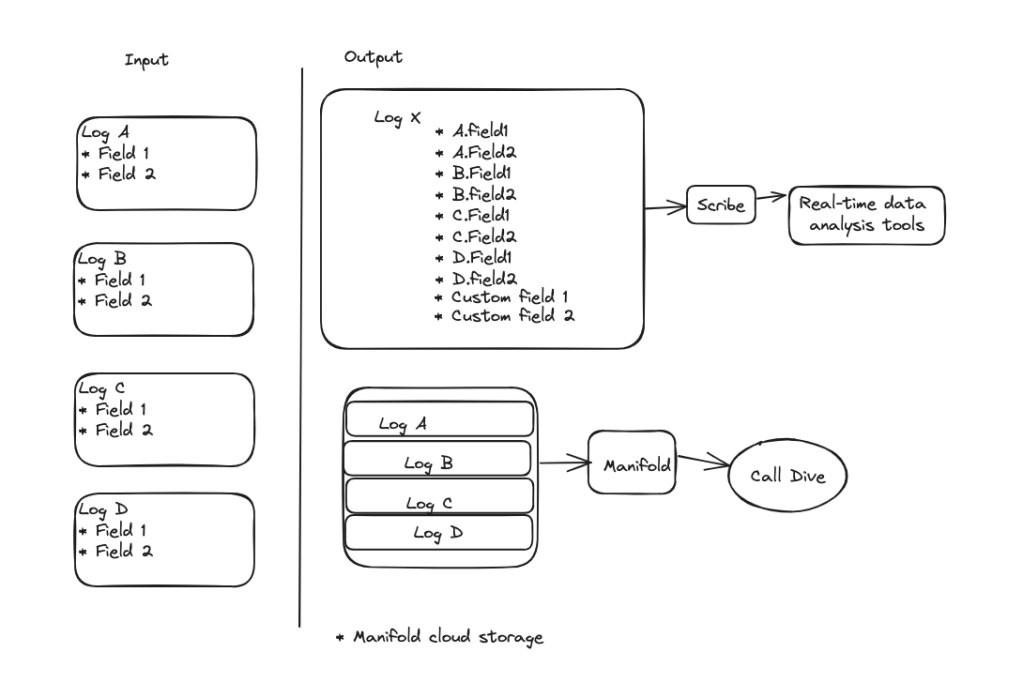
All input loggers share some common fields, including a call identifier. This can be used to aggregate different log types pertaining to the same call, and it produces two outputs. The first is a new aggregated output log composed of each field from each of the input loggers. This effectively performs a join of all tables/logs on the call identifier. This new log also utilizes the standard logging platform and thus makes its way to Scribe and then to backends for our real-time data-analysis tooling. The second output is the list of all the raw log events that are stored in a file in Manifold, our cloud storage. This enables all logs to be fetched with just one request, thus eliminating the performance issues that Call Dive UX faces by having to make dozens of requests. Additionally, if logs have not been yet written to Manifold, they can be provided to Call Dive directly from RAlligator memory, which eliminates any delay between when logs are written and when they can be viewed in Call Dive.
RTC Platform Architecture

- Scribe manager: manages reading from Scribe
- Call index: in-memory, key-value store, where keys are call identifiers and values are lists of associated logs of various types
- Call completion: heuristic used to determine when “enough” logs for a call have been received and can be processed and then flushed to Manifold to free up memory
- Metrics: pull fields from input logs, compute any additional custom metrics, and write out an aggregated output log.
The overall system can be split into two halves—input and output. The input half reads data for all logs from Scribe in real time. It then indexes the data by call identifier in the call index. It also populates some internal per-call bookkeeping such as last log arrival time and different types of logs received. The output half runs periodically on a timer. It is composed of the call-completion heuristic, which uses the bookkeeping to identify calls that have received all the logs. These calls are removed from the index and used to generate the aggregated outputs. This can be expressed in pseudocode as follows:

Challenges
Call completion
RAlligator stores aggregated data in memory. It is a memory-bound system. The rate at which we flush out logs must be the same or lower than the rate at which we input logs. Otherwise, hosts would quickly run out of memory due to the sheer volume of data we process.
From this perspective, we would like to complete and then flush out logs as quickly as possible. This is in conflict, however, with the requirement to completely aggregate all call logs for a call to produce our two aggregated log outputs. On the other hand, the need to flush out data quickly is aligned with our desire to produce aggregated outputs as quickly as possible to minimize the delay to start investigations. The call-completion heuristic is responsible for achieving this fine balance.
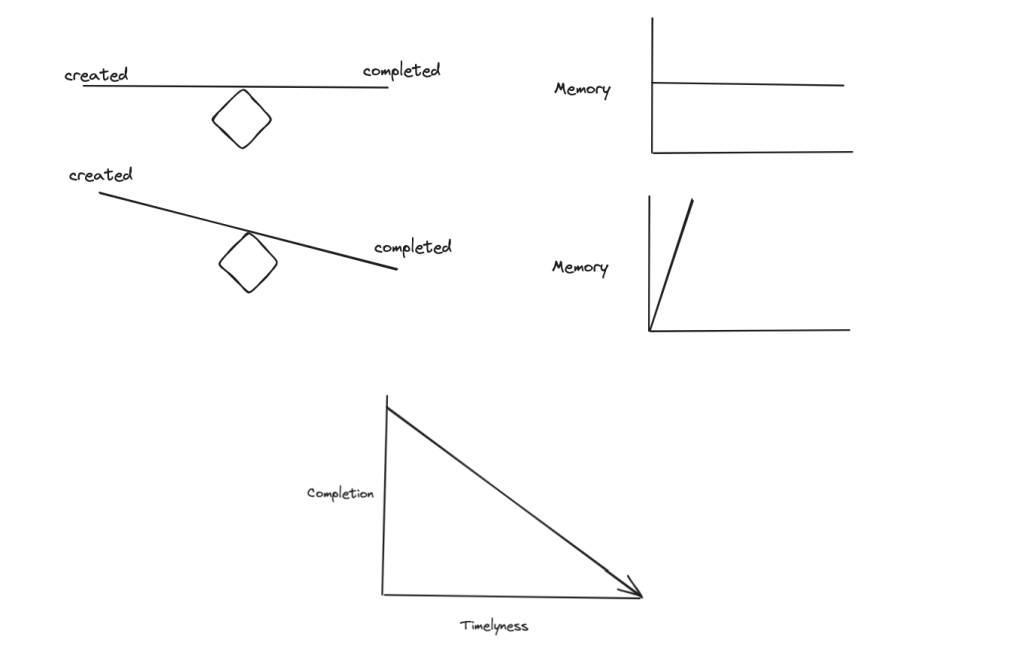
The call-completion heuristic makes a fundamental assumption to achieve this. It assumes that logs are written close to the end of the call or earlier. Due to platform issues, however, logs can arrive late or never arrive at all. In particular, client-side logging reliability and latency is often degraded due to client bandwidth/network issues. We must operate within the rules of our partner apps (IG, Messenger, etc), and logs are only uploaded at select times and under certain conditions, such as during adequate wifi availability, to avoid interfering with app performance and network costs to the user.
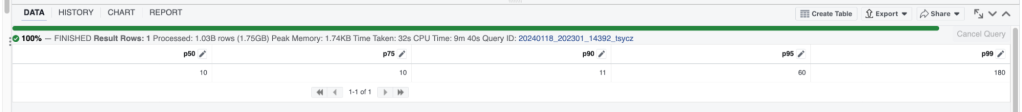
In practice, we have observed log latency for the different types of logs. We found that server-log reliability is fairly high: Almost 100% of the logs arrive within a few seconds of when they are written. The server log is used to determine when a call has ended and which client-side logs to expect. If the expected client-side logs aren’t received before certain timeouts are reached, there’s a high likelihood of the client-side log never arriving. The timeouts are based on measured real-world p99, p95, p90, and p50 latencies of client-log arrival times. To ensure reliability we must continuously monitor the log-arrival latencies and ensure that none of these assumptions are violated.
Though it’s been a bit tricky, we have been able to make this work reliably and cost effectively. RAlligator can run and process all data on a limited number of machines, with plenty of room for growth. And about 90% of the aggregated outputs are written out within 10 minutes of receiving the server log.
In the example in Figure 9, roughly 95% of the aggregated data is completed, meaning that all logs that arrived have been grouped into a single aggregated output. The other 5% are split into another additional aggregated output. This is very reasonable for our use cases.
State Management
RAlligator is a stateful system, as it stores call completion and aggregated log data in memory. This adds the additional complexity of having to snapshot the state for restarts caused by deployments or by scheduled maintenance that moves RAlligator shards from one host to another. This is handled simply by offloading the state to Manifold before shutdown and re-loading after restart.
The key challenge here is handling unexpected crashes when there is no graceful shutdown. This generally results in aggregated data in memory being lost. A backfilling solution could be implemented that replays the data from Scribe. However, the focus is generally to minimize such situations, as any backfilling solution will delay the landing time of aggregated outputs, which conflicts with our requirement to minimize that delay.
It’s important to note that we explored alternatives that would make the service stateless and store state in our distributed key/value store, ZippyDB. This alternative was dropped due to high associated costs.
Summary
RTC observability at Meta is powered by the standard logging infrastructure. A single call emits dozens of logs originating from the various clients and servers involved. The standard infrastructure was a great building block and starting point, but it has limitations. In particular, it’s not suitable out of the box to support user-friendly, call-debugging experiences. The two main tools supporting call debugging faced performance issues and functionality gaps:
- The Call Dive UX would take minutes to load as it fetched logs from dozens of tables.
- Logs would not be available to Call Dive until hours after they were written.
- Due to the lack of support for joins, real-time data-analysis tooling was limited by the type of analysis that could be performed.
A key root cause of these issues was log segregation. RAlligator, a real-time, log-aggregation backend was developed to supplement the standard logging infrastructure to overcome these challenges. Now, with the real-time log aggregation solution deployed:
- Call Dive UX loads within a few hundred milliseconds;
- logs are available to Call Dive as soon as they arrive; and
- a new aggregated table is produced for our real-time analysis tooling, which effectively acts as a join.

