Why does Scribe need more nines?
Scribe is a highly scalable, distributed, durable queue that allows writing and reading large-volume streams of data. As of today it serves more than nine terabytes (TB) per second of writes and more than 30 TB per second of reads, providing less than five seconds of latency—that’s in the 90th percentile.
Scribe was initially built to collect user activity logs (such as ad impressions, clicks, likes, and so on) and transfer them into a data warehouse, where later the data would be processed using a batch-processing model. The results of such processing include analytical data, recommendation models, billing, and more.
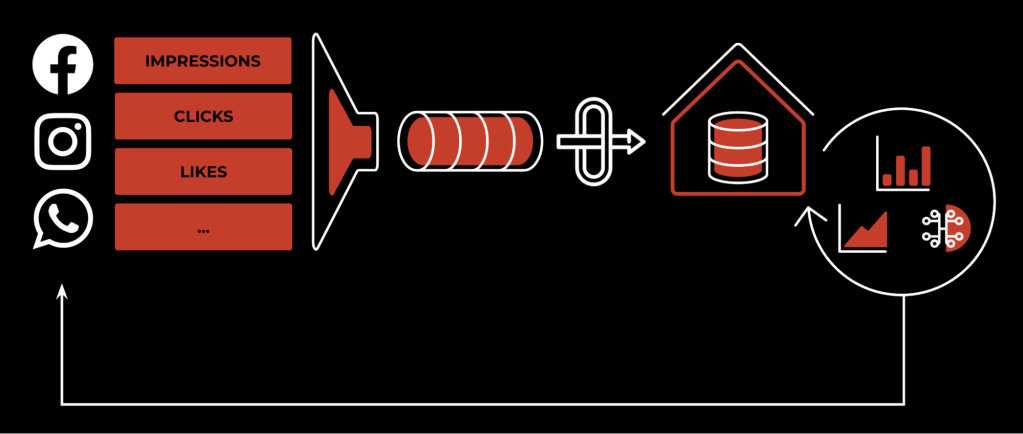
In this kind of use case, write availability is much more important than read availability, as there is only one chance to save the data, but requirements on read availability are much more relaxed, because batch processing can easily tolerate data delays for multiple hours. Scribe’s initial design followed these requirements, and Scribe was optimized heavily for write availability.
Things started to change when the first streaming use cases (including Puma, Stylus, and Scuba) attempted to use Scribe for their needs. Data freshness requirements immediately changed, from hours to low minutes or even seconds. To adjust to this new reality, Scribe architecture went through a major revamp. In the new design, the main focus remained on minimizing data loss on write, achieving 99.99% to 99.999% of data completeness. At the same time, however, while read availability improved significantly, it was an order of magnitude worse—around 99.9% to 99.99%.
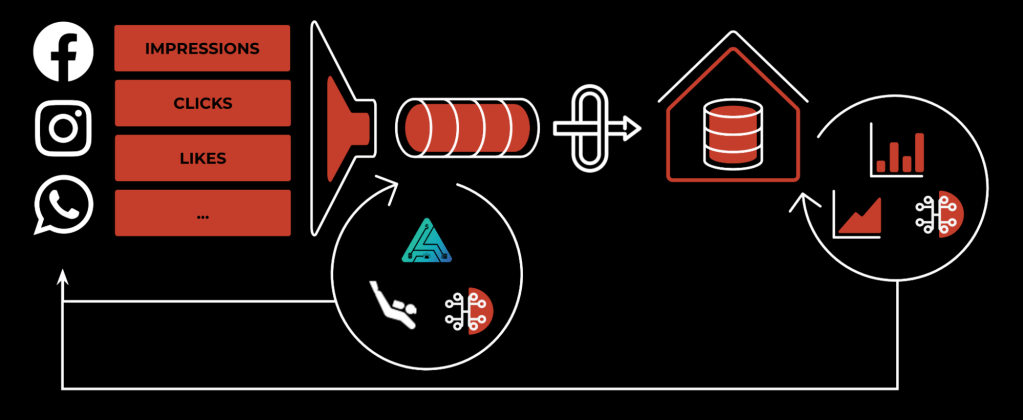
With this new architecture, combined with the overall industry shift towards real-time processing, we observed increasing numbers of critical workloads migrating from a batch or custom solution to using Scribe. With these new workloads, read availability became as important as write. One such example is our ad-pacing service, which tracks whether displayed ads stay within the requested budget.
Over 2021-2022 we had three significant incidents:
- Metadata corruption due to dependency service, with 98 minutes downtime
- Overload due to large client read pattern, with 18 minutes downtime
- Read security check outage due to dependency, with 34.5 minutes downtime
Learning from these and a few other incidents, the team focused on strengthening read availability, with the goal of achieving 99.999% for revenue-critical customers. We identified two main themes for improvement: observability and dependency management.
The main problem with observability was that all the monitoring tools we used for reads were lacking adequate precision to catch degradations early enough to prevent 99.999% availability violation.
As for dependency management, over years of development we brought in dozens of dependencies without proper SLO audit and validation of degraded experience scenarios, so it became quite difficult to assess the potential impact that a single dependency degradation could cause.
Observability journey
Scribe’s main purpose is to deliver data, so our goal was to observe the system end-to-end (E2E) while discovering the latency and reliability violations that are caused by the system itself.
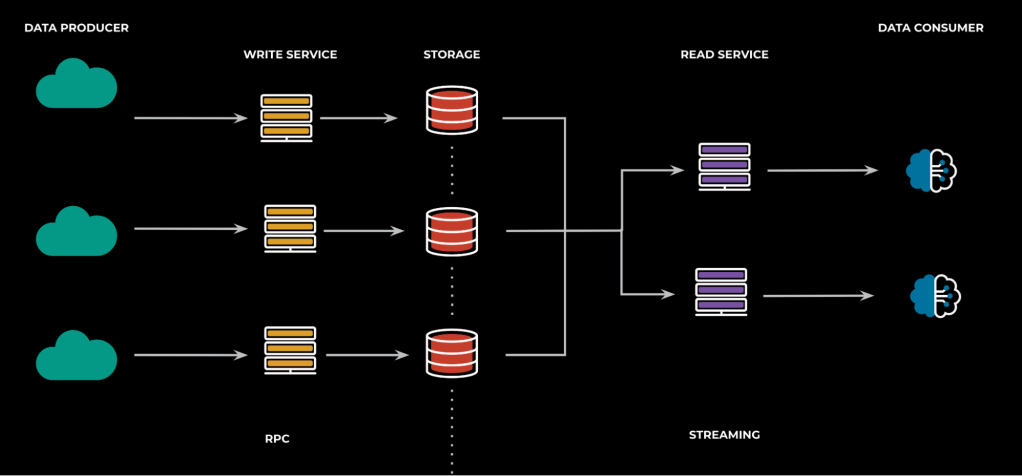
This sounds simple in principle, but Scribe is a system that has two very different types of interaction: On the write path, we have standard RPC interactions, where availability can be measured as the standard ratio of successful requests over total requests, and the latency of the data processing, which is measured as the difference in the timestamps between API entry point and storage.
Read path, on the other hand, is a streaming API where messages flow throughout multiple buffers and the pipeline can be stalled if the customer stops the data consumption process.
In such scenarios, measuring latency with just timestamps is more challenging, because messages can be frozen in buffers for periods of time, and it’s hard to distinguish whether the resulting bottleneck is occurring on the Scribe side or the client side. In addition, customers can request messages written in the past, so just using a storage timestamp out of the box won’t provide a clear indication of read “processing” latency for all use cases.
What does it mean for a streaming system to be available?
Read availability is the measure of the number of successful requests we make to the backend over the total number initially requested. In a streaming world, however, where we expect clients (assuming reasonable stream sharding) to be able to consume messages at least at the same throughput of message production, can we consider a stream to be in a “healthy” state if the messages are processed at a very low throughput and we’re falling behind from the tail of the stream itself?
In Scribe, we don’t believe so, and we decided to define read availability as the signal that the system is up and able to deliver messages at a speed that allows the client to keep up with the stream throughput. And that’s based on the actual speed at which the client application is actively reading from the stream (plus, it takes into account additional hard constraints on the system; for example, the maximum amount of bytes per second for which Scribe can provide guarantees on reading).
Given that we want to monitor this on the client host, we need also to make sure that the host itself is not completely overloaded and that the cause of throughput slowdown is not due to a lack of processing time on client side, given that part of the process of deserialization and unbatching of messages for Scribe happens on the client side.
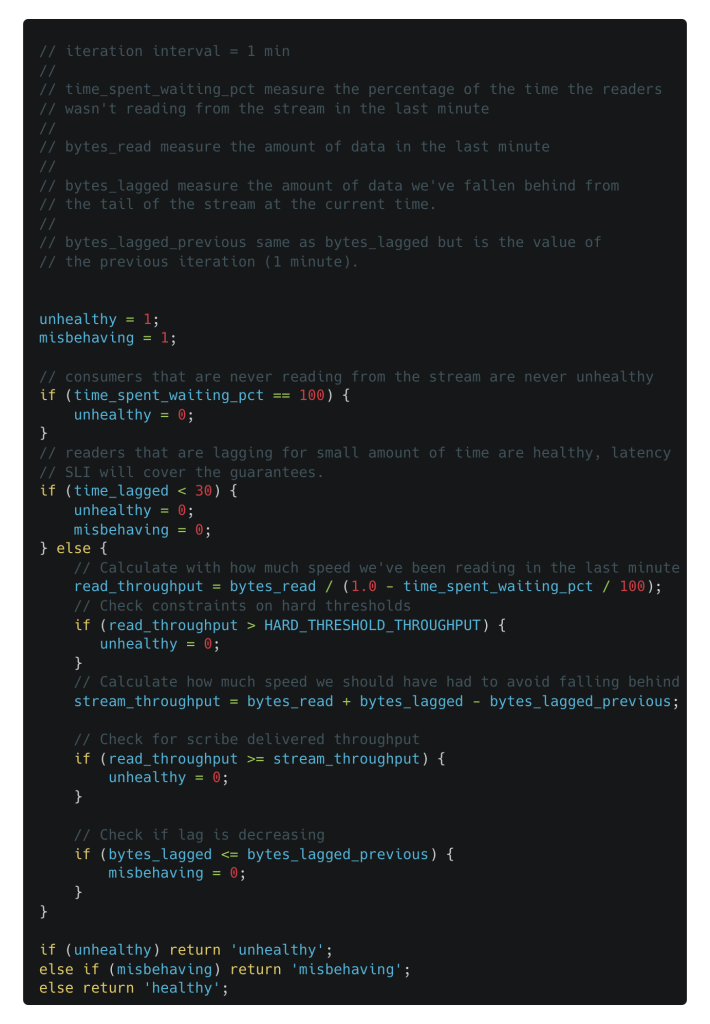
For each client we define three output states:
- Healthy: customer is not falling behind in the stream
- Unhealthy: customer is falling behind in the stream due to Scribe
- Misbehaving: customer is falling behind in the stream due to client-side reasons
Below is a simplified version of how multiple signals can be combined on the client side to understand unavailability of the backend.
How do we measure latency for a streaming system?
Given the modeling described at the start of this chapter, it’s clear that when the client stops reading from the stream, we cannot measure latency introduced by Scribe on the read path, because the messages will be stuck in the buffers.
To understand how we measure latency in Scribe, let’s refer to a simple, client-server model:
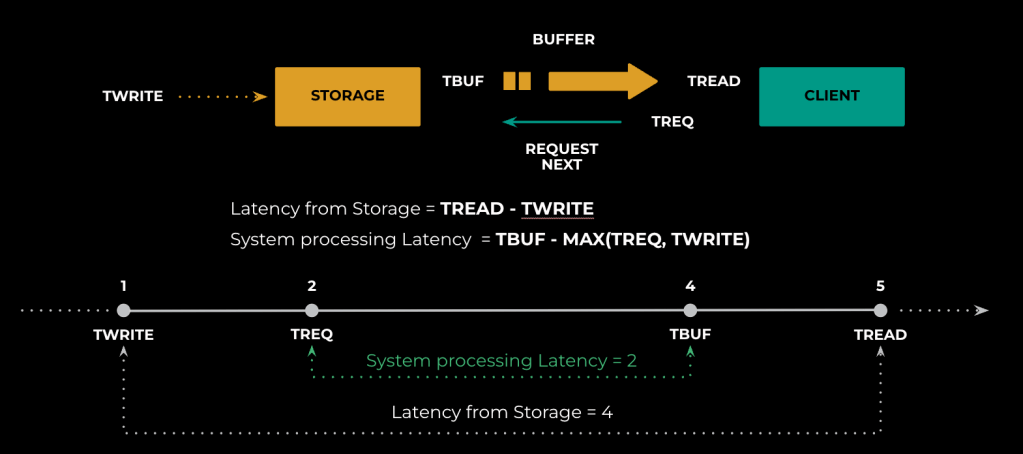
Twrite is the timestamp when the message has been written into the storage.
Tbuf is the timestamp when the message has been written into the output buffer.
Tread is the timestamp when the message has been read by the client application from the buffer.
Treq is the timestamp when the next message has been requested by the client.
If we use only the timestamp measurement, we would calculate latency as Tread – Twrite, but this creates two problems. First, as mentioned, is that we might wind up counting the amount of time the message was stuck in the buffers. Second, if the client is willingly reading data written in the past (as happens for some Scribe customers), it will just add latency that is not due to Scribe at all but to the client’s specific query.
Assuming a simple scenario like the above, we can see that the latency using the “System processing Latency” takes care of the problem of messages stuck in the buffer (Tbuf is used instead of Tread) as well as messages read from the past (Treq is used in max with Twrite).
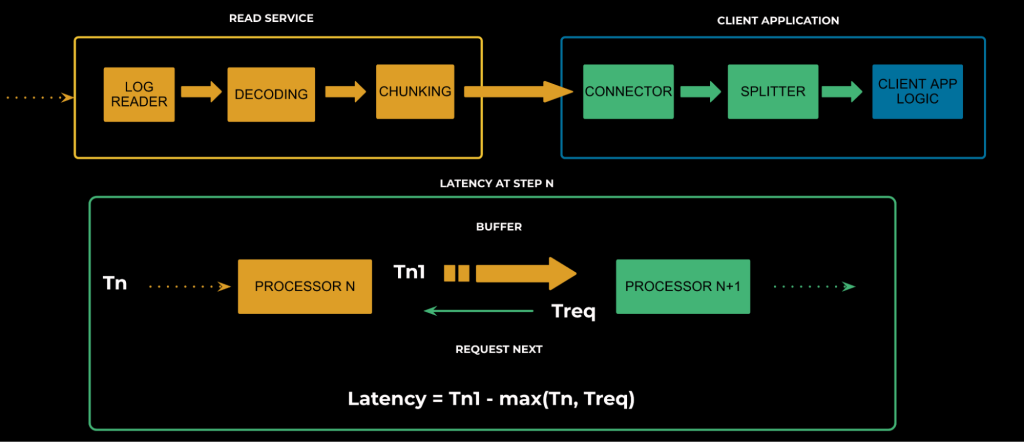
We can then generalize the formula for the entire read path and have the final latency be the sum of all intermediate latencies.
Rolling out better signals
The journey in Scribe now begins with classifying our customer base by criticality using the new metrics, starting from the most important one until we reach the entire customer base (we are currently at approximately 65% of our journey).
These metrics are collected on the client side. This means we address a lot of client-side corner cases, especially on the availability signal, to exclude misbehaving clients and to ensure the metric has a very high signal-to-noise ratio that can be used to wake our on-call engineers at night. Sorting these critical use cases created a pool of well-tested and well-behaved clients that required us to deal with fewer iterations and to have good signal results from the get-go.
Last, during the rollout we were able to observe a lot of corner cases that hadn’t been previously identified; for example, transient behaviors during metadata discovery or slow client reconnection to servers that were impacting temporarily the client guarantee but were too small to be observed on a global scale.
Rollout created additional work items for the team that merged with the Resilience journey, which we present in the next section.
Resilience journey
The 5-nines bar (that is, 99.999%) requires us not only to be reliable in steady state, but also to be resilient in the face of whatever gets thrown in front of the service. Scribe needs to be up even when other services are down. Scribe, however, is a complex, large-scale, distributed-storage system. The system has multiple dependencies, some of which are on external services, while others are on different components of the system. As an example, our read path has a hard dependency on the privacy service to validate whether or not a certain reader is allowed to consume the data it’s requesting. If for any reason the privacy service is experiencing downtime, we have to fail closed, and then nobody can read anything from Scribe. This is an example of a “critical dependency,” a dependency without which the system can’t function. The system is as reliable as its weakest critical dependency. After a couple of dependency-related outages, we knew that dependencies are the next thing we needed to manage in our resiliency journey.
Dependency Management
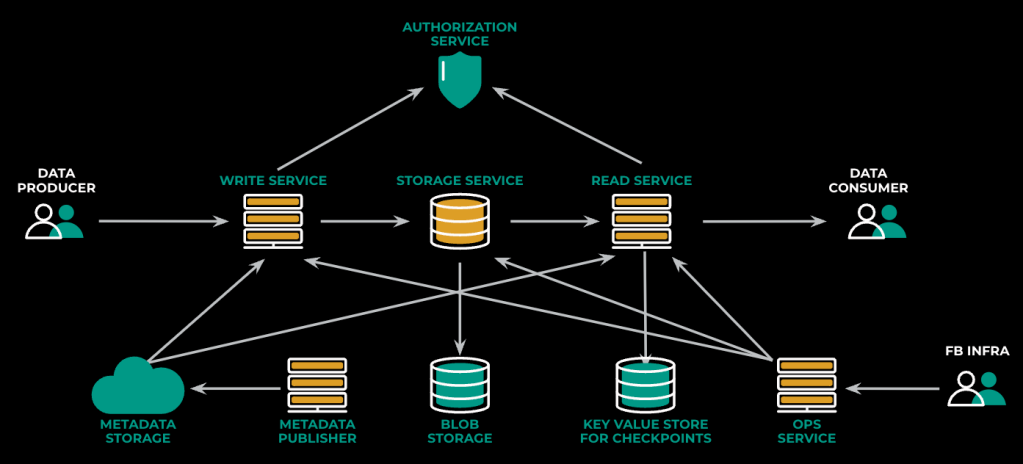
Identifying the dependencies
Our first step in dependency management was to identify all the system’s dependencies. While we knew about most of our critical dependencies already, we needed to discover any hidden dependencies. Dependencies can easily slip into the service, buried under layers of libraries. For example, we found out the hard way that our metadata publishing service had a hidden critical dependency on our less critical ops service. It had been hidden because the ops service was queried behind the scene from a library that was used in the metadata service. This was completely unexpected, and we didn’t know about it when we imported that library.
Inside Meta, most of the service-to-service communication happens over Thrift, and most of the services use a common library called ServiceRouter for doing Thrift RPCs. Given the wide usage of this library, the logging it produces offers a clear picture of whom a certain service is talking to. Reviewing this dataset, we’ve identified the different services to which scribe components talk over Thrift (mainly potential dependencies). But not all services talk over thrift. To complement this data, we’ve also used our annotated network logs (from fbflow) to identify non-thrift interactions. Network logs, on the other hand, are trickier to work with: they are bidirectional, and it’s hard to identify whether a certain interaction is a “dependency” or just a client.
Mitigating dependency risks
Once we identified the dependencies, either through the process described above or from incidents, we started developing plans to mitigate their risk. For some dependencies, the best mitigation was simply to remove that dependency from the critical path. Others required different strategies, and one was to leverage a cache in front of the dependency to absorb its intermittent failure. As long as the dependency is up, we keep updating the cache to keep it fresh. If the dependency goes down, we read the cached data. This mitigation works perfectly well for services such as permission service or for configs. This doesn’t work, however, for services like storage services. For those, we opted for automatic failovers. A watchdog monitors dependency health, and if it observes a spike in error rate, it automatically fails the service over to a different region. This helps mitigate dependency failures before customers even notice them.
Testing mitigation plans
Once a plan for the different dependencies was in place, we started testing those plans. For every test, we picked one of our components and a dependency we wanted to test, and then simulated the failure of this dependency and observed how that component would behave.
To simulate these different kinds of failures, we leveraged Meta’s failure injection framework, Eris. For thrift services, Eris leverages the ServiceRouter library to hijack requests and inject different kinds of failures as a response to the caller. Using that, we’ve simulated dependency connection failures (complete outages), elevated response latencies, and more. For non-thrift services, we used Eris to modify iptables rules to block the communication between the service under test and its dependency on the network level. For some of our own less critical services (such as our ops service), we wanted to make sure that Scribe’s data path wouldn’t depend on them at all. We tested that by taking them down for a certain period of time and ensuring that nothing was affected during their outage.
Before running each test, we documented our expectations: How would the service behave in this scenario? Which alarms would fire, and how fast? Would there be any automatic mitigation that should kick in? If not, what mitigation runbook should we plan to use? We then compared those expectations against what actually happened during the test and documented the results in a post-test report. Out of those tests we discovered unexpected problems. For example:
- We had built an automatic failover mechanism that depends on errors emitted by the service when it fails to talk to the dependency. When we ran the test, however, we found out that the service was lacking proper error handling and it crashes before ever reporting errors, which prevented the automatic failover from kicking in.
- Runbooks in the mitigation step ask to drain that particular service in this region, but it turned out we don’t have tooling to do this drain, and so we wasted more than 30 minutes in recovery time doing them manually.
- The caching technique that we used for authorization didn’t generalize to all authorization types. We knew this only by running this test in production, as only a very specific subset of our customers were affected.
Infrastructure Failures
Every service has what’s known as “failure domains,” the subset of the service that are affected by the same failure source and therefore likely to fail together. One of the most important failure domains is the region in which the service is running. A single region can experience power issues, network backbone issues, network congestion, or even hurricanes and earthquakes. Those events can result in the whole region going down at the same time. The infrastructure is a kind of implicit critical dependency that every service has. While those failures are rare, if we’re aiming for being a 5-nines service, we cannot tolerate being down should those events happen.
The mitigation strategy for such catastrophic events is to quickly move the traffic away from the problematic region before customers observe an impact. Of course being able to gracefully tolerate the loss of a region, especially as a storage service, is not an easy feat. This type of constraint needs to be baked into the architecture of the system and taken into account in capacity planning, and the runbooks have to be exercised frequently.
Over the years, we’ve been participating in a company-wide program that prepares services for handling regional failures. Every week a random region is chosen, and services are expected to move quickly (for example, drain) out of this region. Having participated in more than 50 such tests, uncovering and fixing tens of problems and gaps in our plans and tooling, we’ve become much more comfortable invoking those runbooks during actual disastrous events with minimal customer-perceived impact.
Graceful degradation
Scribe is a multi-tenant system. Under a sudden loss of capacity or a sudden spike in demand, the system sometimes can’t serve all the incoming demand without getting overloaded. In such environments, we want the system to degrade in a way that will at least maintain its availability for the most critical customers by sacrificing for some of the less critical ones. To do so, we wanted to implement a mechanism that would drop the less critical data at the edge of the system. To distinguish the less critical data, however, we needed to classify its criticality. So we came up with a heuristic that determines this criticality based on various signals such as who’s reading and writing this data, and the criticality of the tables (such as hive tables) that will be populated by this data.
Once the classification was in place, we ran graceful degradation tests in prod. The point of those tests was to ensure that 1) the classification is accurate (and stays accurate over time), and 2) the mechanisms for dropping the data work as expected. The test involves dropping all the data under a certain criticality threshold at the edge for a certain period of time.
Executing those tests in prod proved to be extremely useful. We’ve found some customers running in specific environments that interpreted this “Drop the messages” signal as a “Try again later” signal. What began as a load-shedding exercise ended up being a load-test exercise. This is exactly the kind of thing that you don’t want to observe for the first time in a disastrous event, and hence why it’s important to run those tests in prod.
What’s next
Automated signals for client recovery
Well-behaved clients are normally able to recover quickly from a Scribe failure. Assuming the system becomes available again, they will restart their reading right away and catch up with the data. But this assumption is not true for the entire customer base, and we want to explore the opportunity to inject specific types of failures in small samples of customer readers and observe their reactions. We’ll use the new service level indicators (SLIs) to understand whether or not they are healthy clients (able to catch up) or misbehaving (falling behind). Signaling misbehaving customers to client owners will enable them to address hidden problems with minimal impact before a much larger incident will impact them adversely on a larger scale.
Vacuum Testing
To make sure that nothing sneaks into our dependency list over time, we’re currently experimenting with vacuum testing using Belljar. Belljar sets up a completely isolated environment in which binaries can run. For each binary to function in Belljar, we have to create an allowlist for the set of services to which this binary can talk. Once the initial allowlist is populated with the list of known dependencies, and we manage to get the binary functional, any new critical dependency that is added afterwards will be blocked, and the test will fail. We then either have to add this new dependency manually to the test’s allowlist—or, if the addition was unintentional, we investigate how it leaked into the service. In this way, we maintain tighter control on the service’s dependencies.


