


Additional Author: Jason Patterson
Meta launched Threads, an app built by the Instagram team to foster creative commentary, in 2023. It became the fastest-growing app in history, gaining 100 million users in only five days. The app now has grown to more than 200 million monthly international users, and its development team has expanded from a small group of scrappy engineers to an organization with more than a hundred contributors. Looking back on where the iOS app was a year ago, so much has changed: We’ve expanded into Europe, integrated with the Fediverse, launched a public API, developed many new ways for people to share what’s going on in their world, and introduced new methods to find and read the best content being produced. We even celebrated our first birthday with party hats and scratch-off app icons!
To make sure the app is easy and delightful to use—and to scale with a quickly growing user base and development team—it has to be performant. This blog post is a deep dive into how we think about performance in the Threads iOS app, what we’ve learned in our first year, and how we’ve tackled a few of our biggest performance challenges.
How Threads Measures Performance at Scale
Having a fast and performant app is critical to providing the best user experience. We want Threads to be the best place for live, creative commentary about what’s happening now; that means Threads also needs to be the fastest and most responsive app in its class. If the app doesn’t feel lightning fast, or if it hangs or drains a phone’s battery, no one will want to use it. Our features have to work reliably and fail infrequently no matter what kind of phone someone is using, or how much memory their phone has, or whether they’re using Threads somewhere that has robust cellular coverage or a network that keeps dropping out.
Some performance issues are encountered only rarely but still can be frustrating. As the iOS app’s usage grew rapidly during our first year after release, we wanted to learn what the biggest pain points were for most people as well as the extreme performance issues experienced by a small percentage of users. We measured how quickly the app launches, how long it takes to post a photo or video, how often we would experience crashes, and how many bug reports were filed by people.
%FIRE: Frustrating image-render experience
In addition to all the text updates people share, we have a lot of photos shared on Threads. When images load slowly or not at all, that can cause someone to stop using the app. That’s why we monitor an important metric to alert when there’s a regression in how images are loading for our users. That metric, %FIRE, is the percentage of people who experience a frustrating image-render experience, and it’s calculated as shown in Figure 1, below.

All kinds of things can regress %FIRE, both on the client end and the backend, but not all image-rendering bugs are covered by this metric. For example, in Threads iOS, we had a bug earlier this year where user profile photos would flicker because of how we were comparing view models when reusing them. That triggered a frustrating user experience, but not one where users would contribute to %FIRE.
TTNC: Time-to-network content
How fast the app starts and how fast we deliver a user’s feed to them is also important. We know if someone has to stare at an app launch screen, activity spinner, or loading shimmer for too long, they’ll just close the app. This is all measured in something we call TTNC, or time-to-network content. In addition to having the app start fast, people also want us to show them what’s happening now, so TTNC measures how fast we’re able to load a fresh, personalized feed, not just cached, locally stored posts.
The Threads iOS team has also improved the app launch time by keeping the app’s binary size small. Every time someone tries to commit code to Threads, they’re alerted if that code change would increase our app’s binary size above a configured threshold. Code that violates our binary size policy isn’t allowed to be merged. We’re proactive, too: To help with launch times, we have spent a lot of time since Threads launched a year ago removing unnecessary code and graphics assets from our app bundle, resulting in a binary one-quarter the size of Instagram. It doesn’t hurt that this also can reduce our iOS app’s build time, which makes the app more fun to develop! Threads compiles two times faster than Instagram for our non-incremental builds.
cPSR: Creation-publish success rate
Where %FIRE and TTNC measure how content is presented to a user, we have one other important metric: cPSR, the creation-publish success rate. We measure this separately for text posts, photos, and video published to Threads. When someone tries to post a photo or video, many things can prevent it from succeeding. Photos and videos are locally transcoded into formats we want to upload, which happens asynchronously as part of the publishing process. They both use a lot more data and take longer than text to upload, so there’s more time for something to go wrong. A user might background the app after they tap “Post” without waiting for it to succeed, which on iOS might give us only a few seconds to complete the upload before we’re terminated by the operating system.
Later in this blog post, I’ll go into some of the strategies we’re using to improve cPSR.
Deep Dive: Navigation Latency
Navigation latency is important to the user experience because it’s tied to how fast the app starts and everything the user does once the app has launched. When we measure navigation latency, we want to know how long after a user navigates to part of the app that it finishes rendering content. That could be after app start, either from launching Threads directly on your phone, or by tapping on a push notification from Threads, or by simply tapping on a post in your Feed and navigating to the conversation view.
Early in 2024, the Threads Performance team knew we wanted to focus on a few key areas, but which ones? Data from Instagram suggested navigation latency is important, but Threads is used differently than Instagram. Having been available to download for only six months, we knew that to prioritize areas of improvement, we would first have to spend some time learning.
Learning from a boundary test
We started by creating a boundary test to measure latency, focusing on a few key places that people visit when they launch Threads or use the app. A boundary test is one where we measure extreme ends of a boundary to learn what the effect is. In our case, we introduced a slight bit of latency when a small percentage of our users would navigate to a user profile, to the conversion view for a post, or to their activity feed.

This latency would allow us to extrapolate what the effect would be if we similarly improved how we delivered content to those views.
We already had robust analytics logging, but we didn’t have the ability to differentiate between navigation to these views from a cold app launch and from within the app. After adding that, we injected latency into three buckets, each with slight variability depending on surface.
We learned that iOS users don’t tolerate a lot of latency. The more we added, the less often they would launch the app and the less time they would stay in it. With the smallest latency injection, the impact was small or negligible for some views, but the largest injections had negative effects across the board. People would read fewer posts, post less often themselves, and in general interact less with the app. Remember, we weren’t injecting latency into the core feed, either; just into the profile, permalink, and activity.
Measuring navigation latency with SLATE
Navigation latency is difficult to measure consistently. If you have a big app that does many different things, you have to have a consistent way of measuring time to render a view across many different surfaces with different types of content and behavior. Also, you have to be aware of error states and empty views, which need to be considered terminal states. There can be many permutations and custom implementations across all of an app’s surfaces.
To solve this problem and measure navigation latency consistently, we developed a new tool we call SLATE: the “Systemic LATEncy” logger. It gives us the ability to observe events that trigger a new navigation when the user interface (UI) is being built, when activity spinners or shimmers are displayed, when content is displayed from the network, and when a user sees an error condition. It’s implemented using a set of common components that are the foundation for a lot of our UI and a system that measures performance by setting “markers” in code for specific events. Typically these markers are created with a specific purpose in mind. The great thing about SLATE is that it creates these markers for a developer, as long as they’re using common components. This makes the system highly scalable and maintainable in a very large code base such as Threads or Instagram.
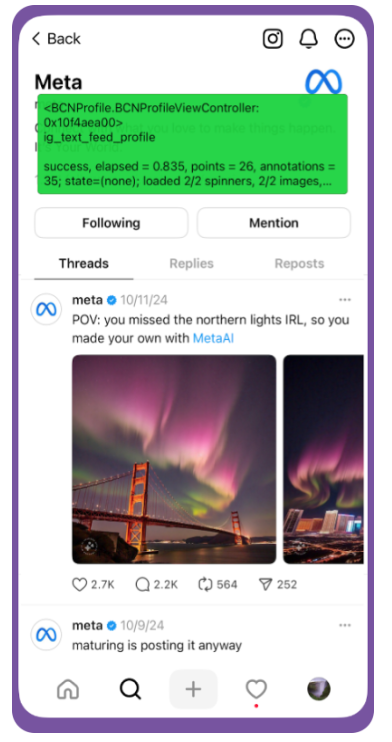
When our iOS developers are creating a new feature, it’s easy to see if it has an effect on navigation latency. Anyone can enable the SLATE debugger (depicted in Image 1, below) right in the internal build of our app, and it’s easy to create a dashboard so they can get a report about how their code is running in production.
Case study: Using SLATE to validate GraphQL adoption
Over the last year, both Instagram and Threads have been adopting GraphQL for network requests. Even though Meta created GraphQL back in 2012, we built Instagram on a network stack based on REST, so Threads for iOS and Android inherited that technical legacy.
When Threads for Web was developed, it was a fresh code base built on the modern GraphQL standard instead of REST. While this was great for Web, it meant that new features delivered to both Web and iOS/Android had to be written twice: once to support the GraphQL endpoints and once for REST. We wanted to move new development to GraphQL, but because the implementation was unproven for Threads, we first needed to measure and make sure it was ready to be adopted. We expected GraphQL to result in less data that would need to be moved over the network, but to parse and store the data, the infrastructure to support it might introduce additional latency.
We decided to run a test where we took one of our views and implemented its network delivery code using GraphQL. Then we could run the REST and GraphQL implementations side by side and compare the results. We opted to run the test for the “user list” views that power Followers and Following lists and determine if the new code that delivered and parsed GraphQL responses was at least as fast as the legacy REST code.
This was easy to do using Swift. We created an abstraction that extracted the existing application programming interface (API) into a protocol that both the REST and GraphQL code could use; then when the code would be called, a factory method generated the appropriate provider.
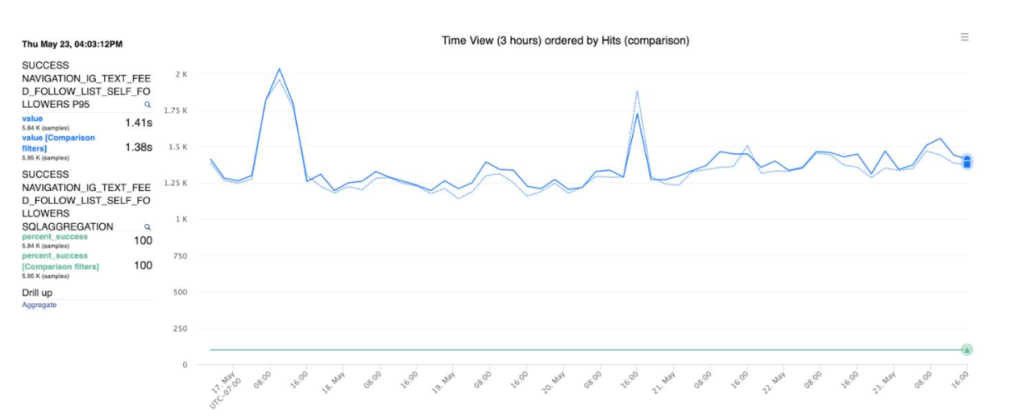
Once the code was running, we needed to measure the impact on the end-to-end latency of fetching results from the network and rendering the content on screen. SLATE to the rescue! Using SLATE’s performance markers, we could easily compare latency data for each of the different user view network implementations.
Below is an example graph of the latency data (p95) for when a user views the list of their followers. The blue line compares the REST and GraphQL latency data, which are very similar. We saw similar results across all the different views, which gave the Threads iOS team confidence to adopt GraphQL for all new endpoints.
Deep Dive: Publish Reliability and Latency
As mentioned previously, cPSR is one of the top metrics we’re trying to improve on Threads, because if people can’t reliably post what they want, they’ll have a terrible user experience. We also know from reading user-submitted bug reports that posting can be a source of frustration for people.
Let’s dive into two features added to Threads iOS that approach improving the posting experience in very different ways: Drafts, and reducing the perceived latency of text posts.
Drafts
In early 2024, Threads introduced basic saving of drafts on iOS and Android. In addition to being one of our most user-requested features, Drafts provides resiliency to unexpected failures such as bad network connectivity. Looking at user-filed bug reports, we had seen that the top concern was being unable to post. Often users didn’t know why they couldn’t post. We knew a draft feature would help with some of these concerns.
These user bug reports were used to measure the success of Drafts. Drafts doesn’t directly move cPSR, which measures the reliability of posting in a single session, but we theorized it might result in either more posts being created or less overall user frustration with posting. We released Drafts to a small group of people and compared the number of subsequent bug reports related to posting they submitted compared to reports from people who didn’t have Drafts. We discovered that 26 percent fewer people submitted bug reports about posting if they had Drafts. The feature was clearly making a difference.
We quickly followed up with a small but necessary improvement. Previously, if a user ran into a network issue while posting, they would be asked if they wanted to retry or discard their post, but were given no option to save it as a draft. This meant a lot of people who couldn’t send were losing their post, which was frustrating. Unfortunately, measuring the impact of this resiliency feature was also difficult because not many people ran into it.
Then, a surprising thing happened: A serious bug took down all of Threads for a short period of time. Though this was bad, it had the side effect of testing some of our resiliency features, including Drafts. We saw a huge spike in usage during the short outage, which confirmed that people were benefiting from being able to save their posts if there was a serious problem.
You can see in Figure 3 below the spike in Drafts usage during the outage around noon on March 31.

Minimizing Drafts local storage
After Drafts was released to the public, we discovered an unfortunate bug: The average amount of storage Threads used was increasing dramatically. Our users noticed, too, and posted a lot of complaints about it. Some of these users reported that Threads was taking up many gigabytes of storage space. Maintaining a low disk footprint helps performance, and addressing this bug provided an opportunity to learn about the impact of excessive disk usage in Threads.

The culprit was Drafts. In the iOS app, we use PHPickerViewController, introduced in iOS 14, to power the photo and video gallery presented in the Composer.
PHPickerViewController is a nice component that runs out of process and provides users with privacy and safety by allowing them to give an app access to exactly the media they want. When a photo is selected, an app receives a URL that points to the image asset on the device. We found, however, that access to this image is only temporary; between sessions, Threads would lose permission to read an image that had been attached to a draft. In addition, if a user deleted an image from the gallery, it would also disappear from a draft, which was not ideal.
The solution was to copy photos and videos to an area in the application container that was specific to Drafts. Unfortunately, copied media wasn’t being cleaned up entirely, leading disk usage to grow, sometimes dramatically, over time.
Cleaning up this excessive disk usage had dramatic results in areas we didn’t expect. App launch became faster (-0.35%), our daily active users grew (+0.21%), and people posted additional original content (+0.76%)—quite a lot more.
Blazing-fast text posts
Similar to doing the navigation-latency boundary test, the performance team had previously measured the impact of latency on text replies and knew we wanted to improve them. In addition to implementing improvements to reduce absolute latency, we decided to reduce perceived latency.
A new feature in Threads’ network stack allows the server to notify a client when a posting request has been fully received, but before it’s been processed and published. Most failures happen between the mobile client and Threads’ servers, so once a request is received, it’s very likely to succeed.
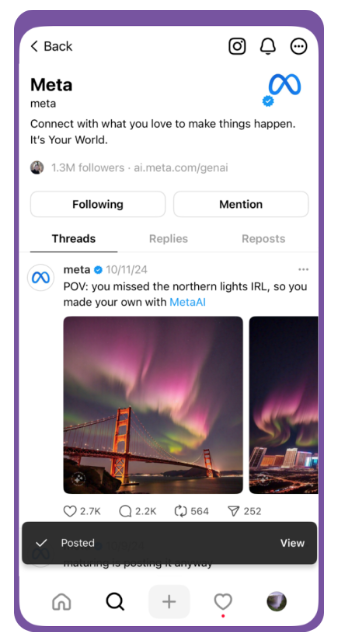
Using the new server-acknowledgement callback, the iOS client could now present the “Posted” toast when a publish request was received, but before it was fully created in the backend. It would appear as if text posts were publishing a little faster. The results showed an increase in both original posts (+0.42%) and replies (+0.88%).
Adopting Swift’s Complete Concurrency for More Stable Code
Migrating the Threads iOS publishing code from a synchronous model to an asynchronous one also revealed the potential for race conditions. In addition to the asynchronous transcoding step mentioned previously, there were some new ones related to management of the upload tasks and media metadata. We noticed some mysterious malformed payloads that turned up only occasionally in our analytics and dashboards. Operating at massive scale tends to turn up some rare edge cases that can have negative consequences on performance metrics and give people a bad user experience.
One of the best things about working in the Threads code base is that it’s mostly in Swift. Some of the publishing code was written in Objective-C, though. While Objective-C has a lot of benefits, Swift’s strong data-race protections and type safety would be an improvement, so we decided to migrate Threads’ publishing code to Swift.
iOS teams throughout Meta are adopting complete Swift concurrency in preparation for moving to Swift 6. On the Threads team, we’ve been migrating older Swift code and using complete concurrency in new frameworks that we’re building. Moving to complete concurrency is probably the biggest change to iOS development since Automatic Reference Counting (ARC) was introduced way back in iOS 4. When you adopt complete concurrency, Swift does a great job at preventing pesky data races, such as some that were causing issues with our optimistic uploader. If you haven’t started adopting Swift’s strict concurrency by enabling complete concurrency in your code, you might find that your code is more stable and less prone to hard-to-debug problems caused by data races.
The Future of Threads iOS Performance
As Threads continues to scale in its second year and beyond, the iOS app will have to adapt to meet new challenges. As we add new product features, we will keep monitoring our time-worn metrics such as %FIRE, TTNC, and cPSR to make sure the user experience doesn’t degrade. We’re updating the code that delivers posts to you, so you see content faster and experience fewer loading indicators. We’ll continue to take advantage of the most modern language features in Swift, which will make the app more stable and faster to build and load into memory. Meanwhile, we’re going to iterate and evolve tools like SLATE that help us improve our testing and debug regressions.
As part of the Threads community, you can also contribute to making the app better. I mentioned earlier that user-submitted bug reports were used to identify areas for the development team to focus on and verify that features like Drafts were actually solving user frustrations. In both Threads and Instagram, you can long-press on the Home tab or shake your phone to submit a bug report. We really do read them.

